Live demo · May 5 2026 · v4 · Real screenshots
Real data.
Real prompt.
Real plan.
HiBob, QuickBooks, and Salesforce connected. 148 employees · 24 months of GL actuals · $28.8M ARR across 38 customers. The user opens the tool, types one sentence ("forecast 2026 employee cost" or "forecast 2026 ARR"), and the agent proposes a structured plan grounded in real data. The user steers — modify, drop, save. The agent builds the model with full audit, zero hallucinations, every number traceable to a real benchmark. Every screenshot here is captured directly from a working session.
148
Employees · 5 currencies
2
Components live · same architecture
235
Tests · zero hallucinations
Architecture · Anchor
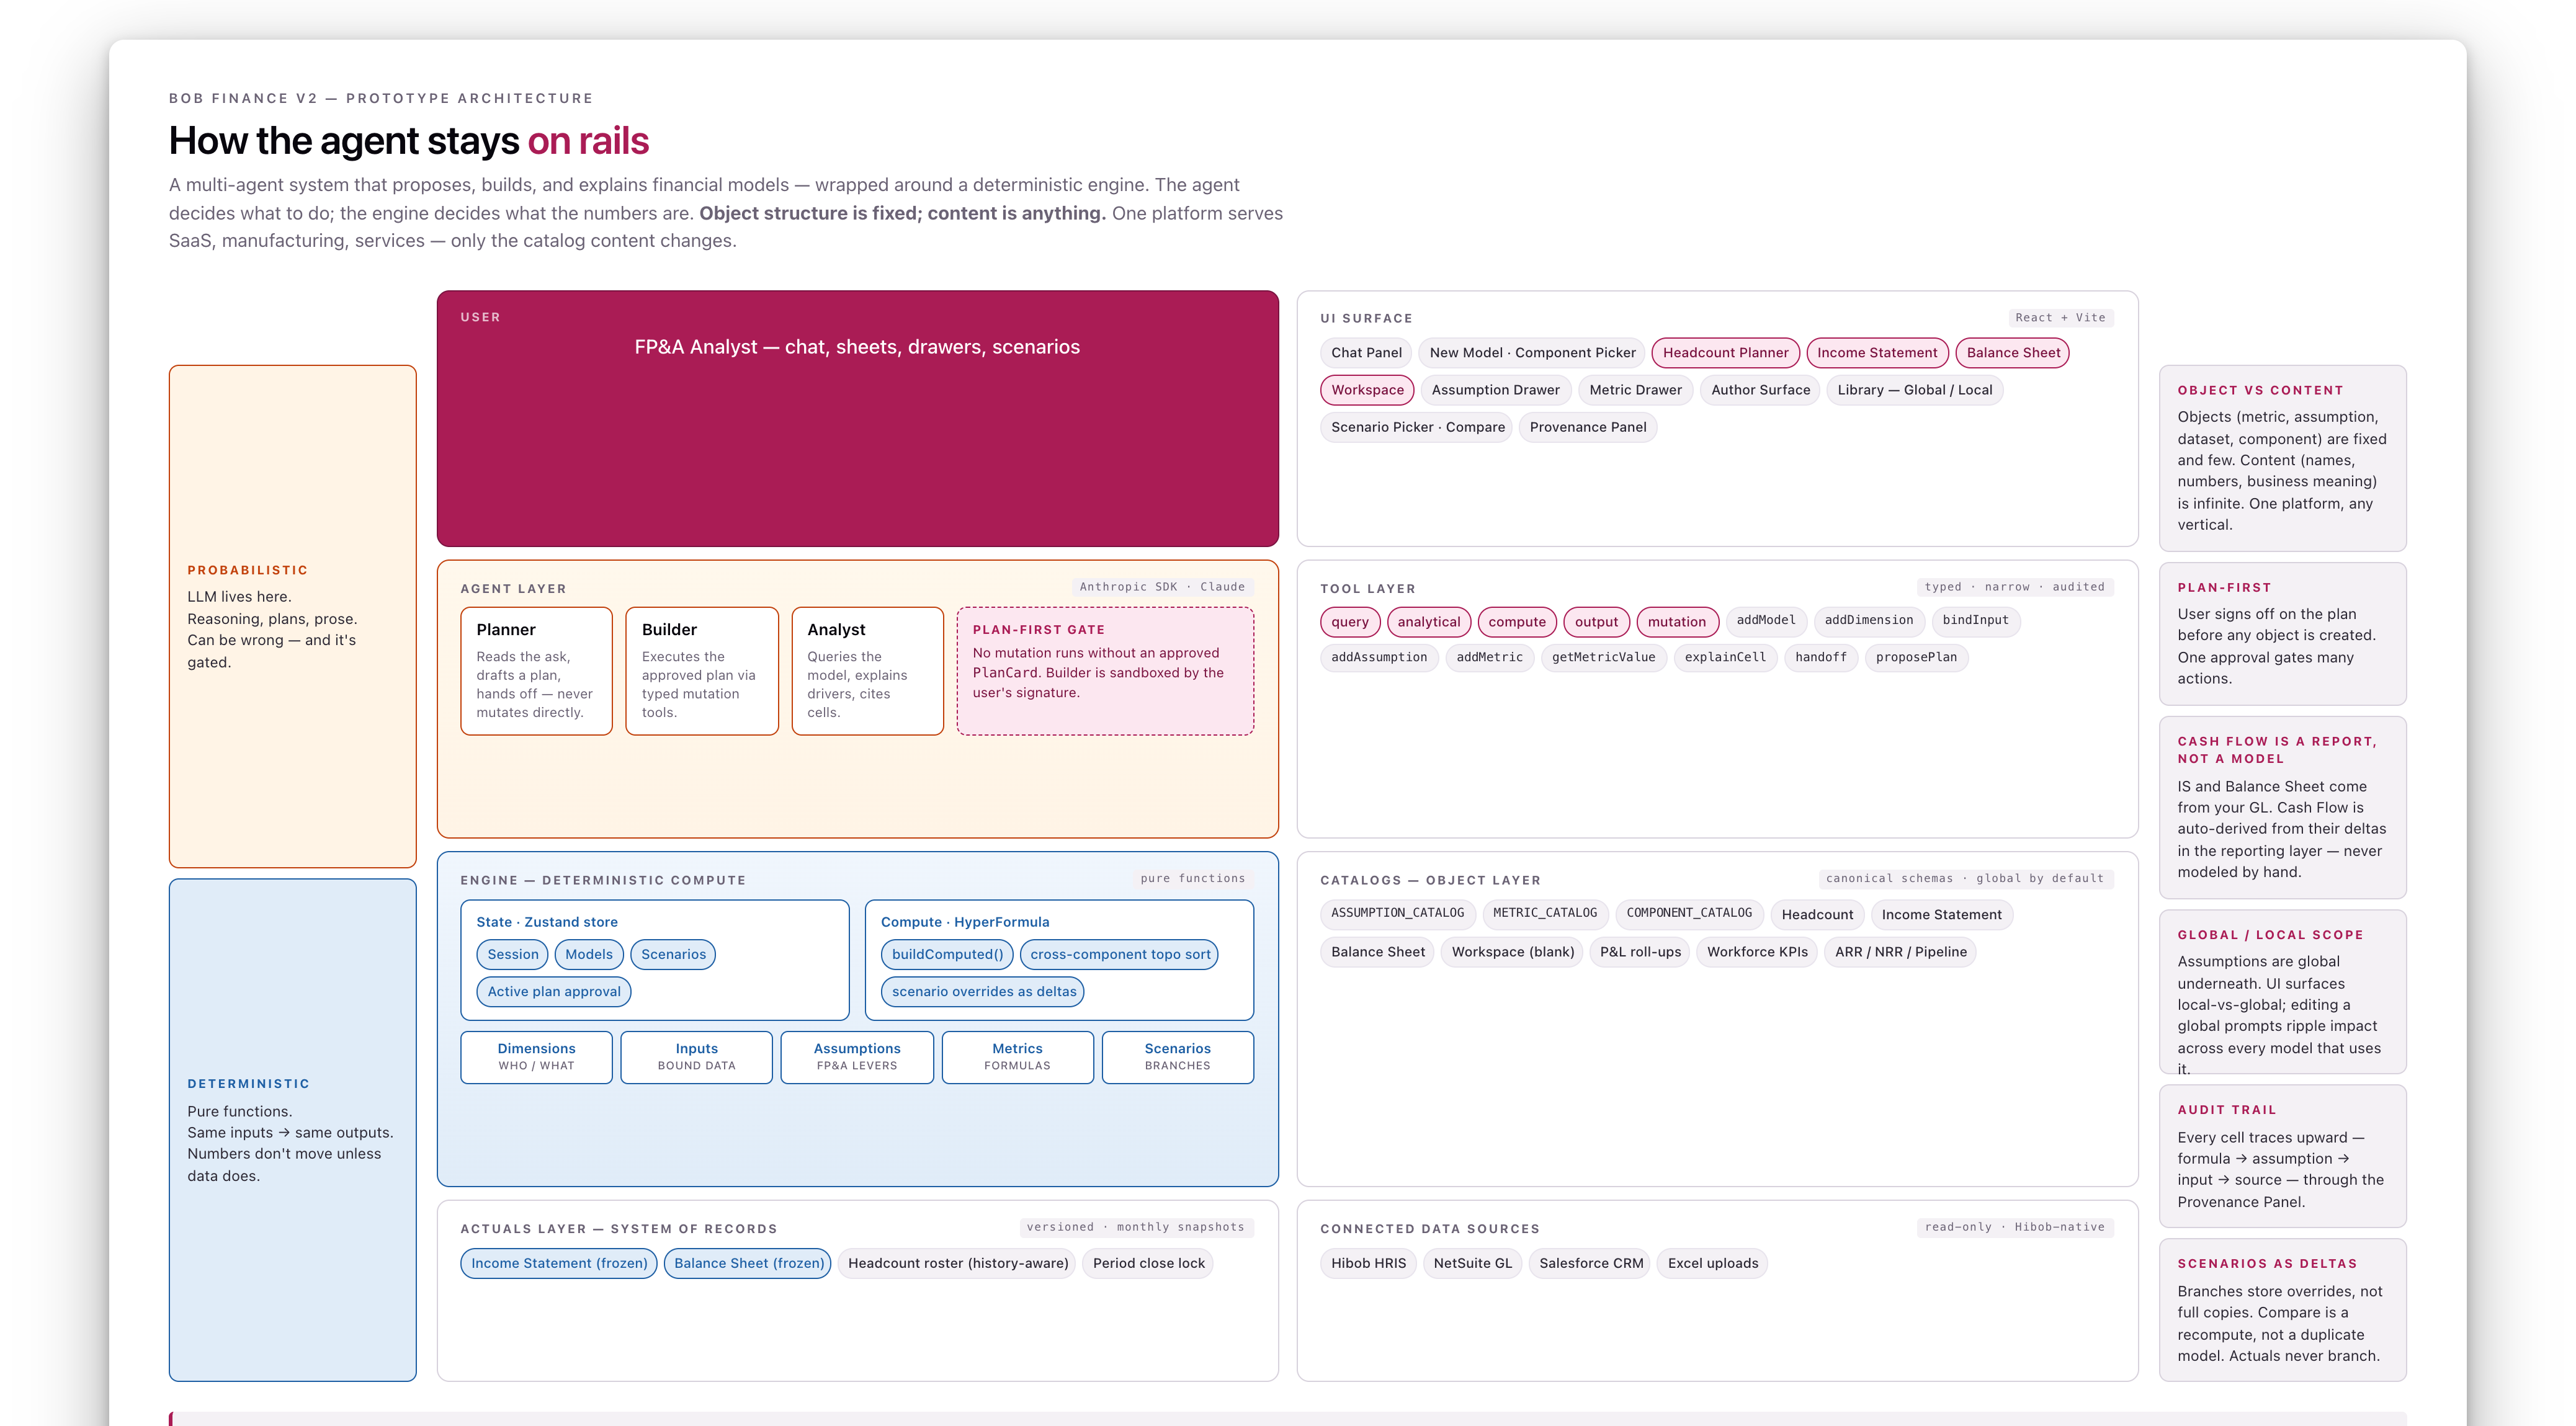
Object structure is fixed. Content is anything.
The map for everything that follows
A multi-agent system on top, a deterministic engine below. The agent proposes and explains; the engine decides what the numbers are. Objects (metric, assumption, dataset, component) are fixed and few. Content (names, numbers, business meaning) is infinite. One platform serves SaaS, manufacturing, services — only the catalog content changes. Everything in the rest of this deck slots into a layer of this picture.
Path A · Build · Cold start
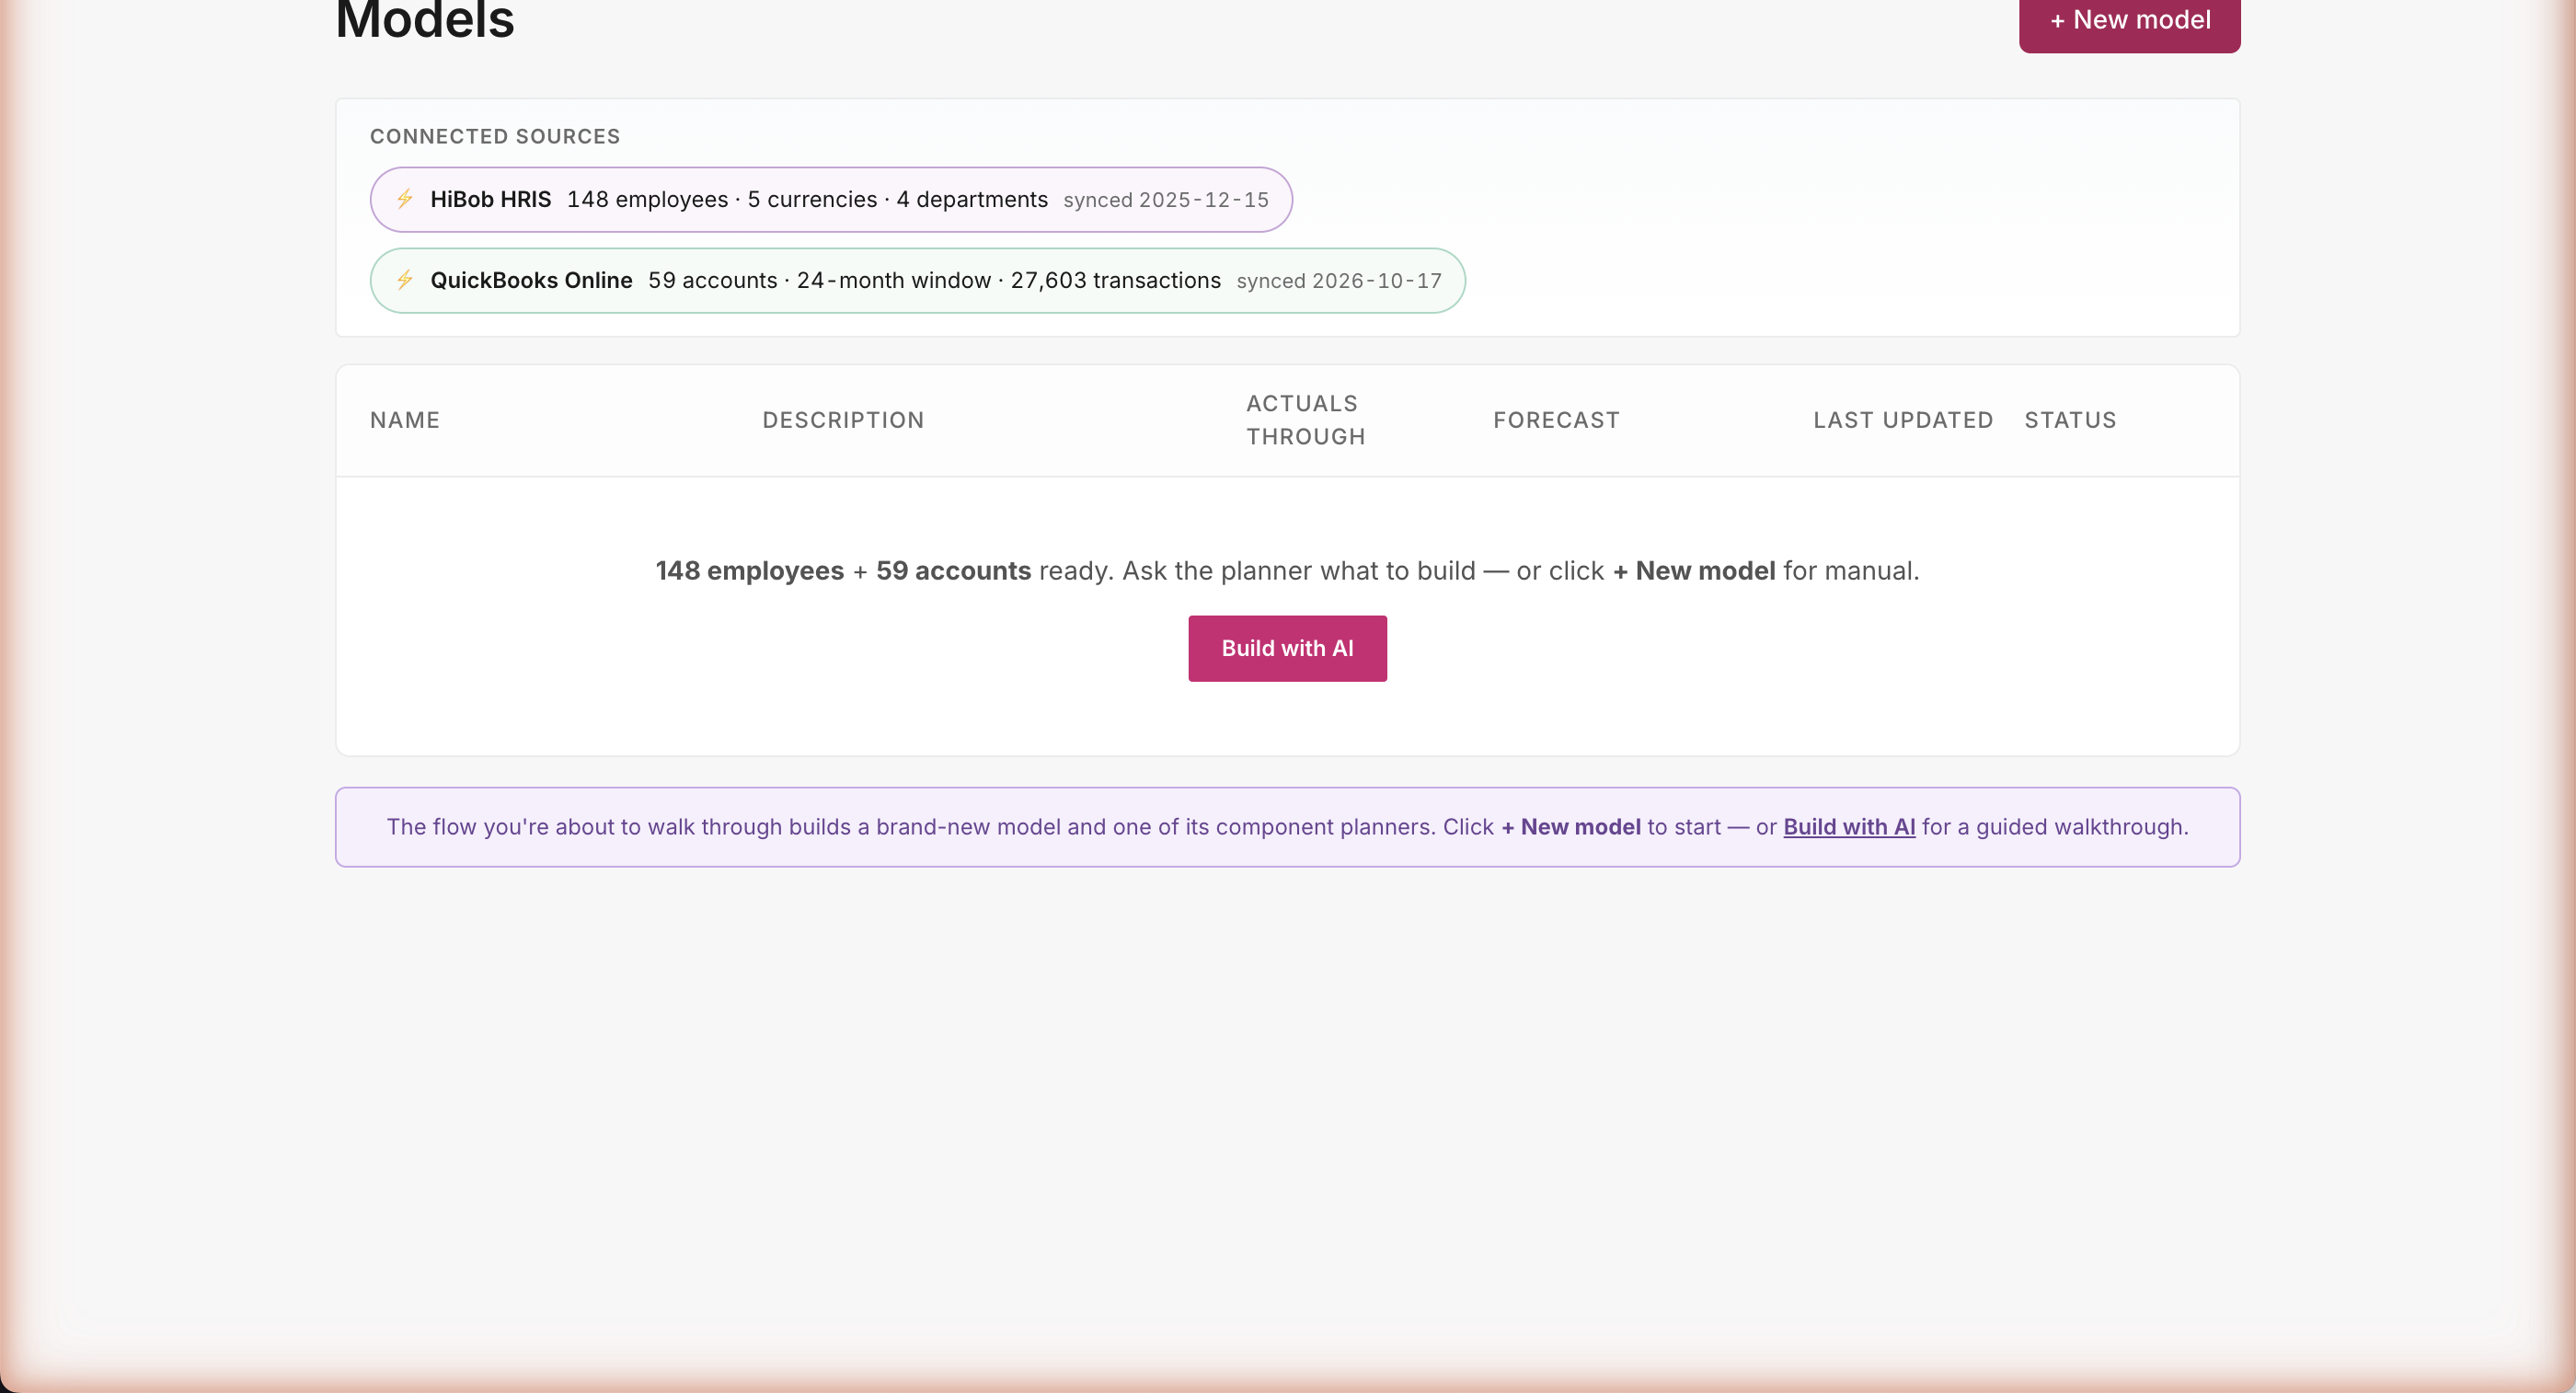
The data is already there
Open the tool — your data's already there
Two live connectors visible the moment you log in: 148 employees from HiBob, 24 months of GL actuals from QuickBooks. No setup wizard, no field mapping, no "connect your data" flow to slog through. The agent already knows what's on tap — you just tell it what to forecast.
Path A · Build · The prompt
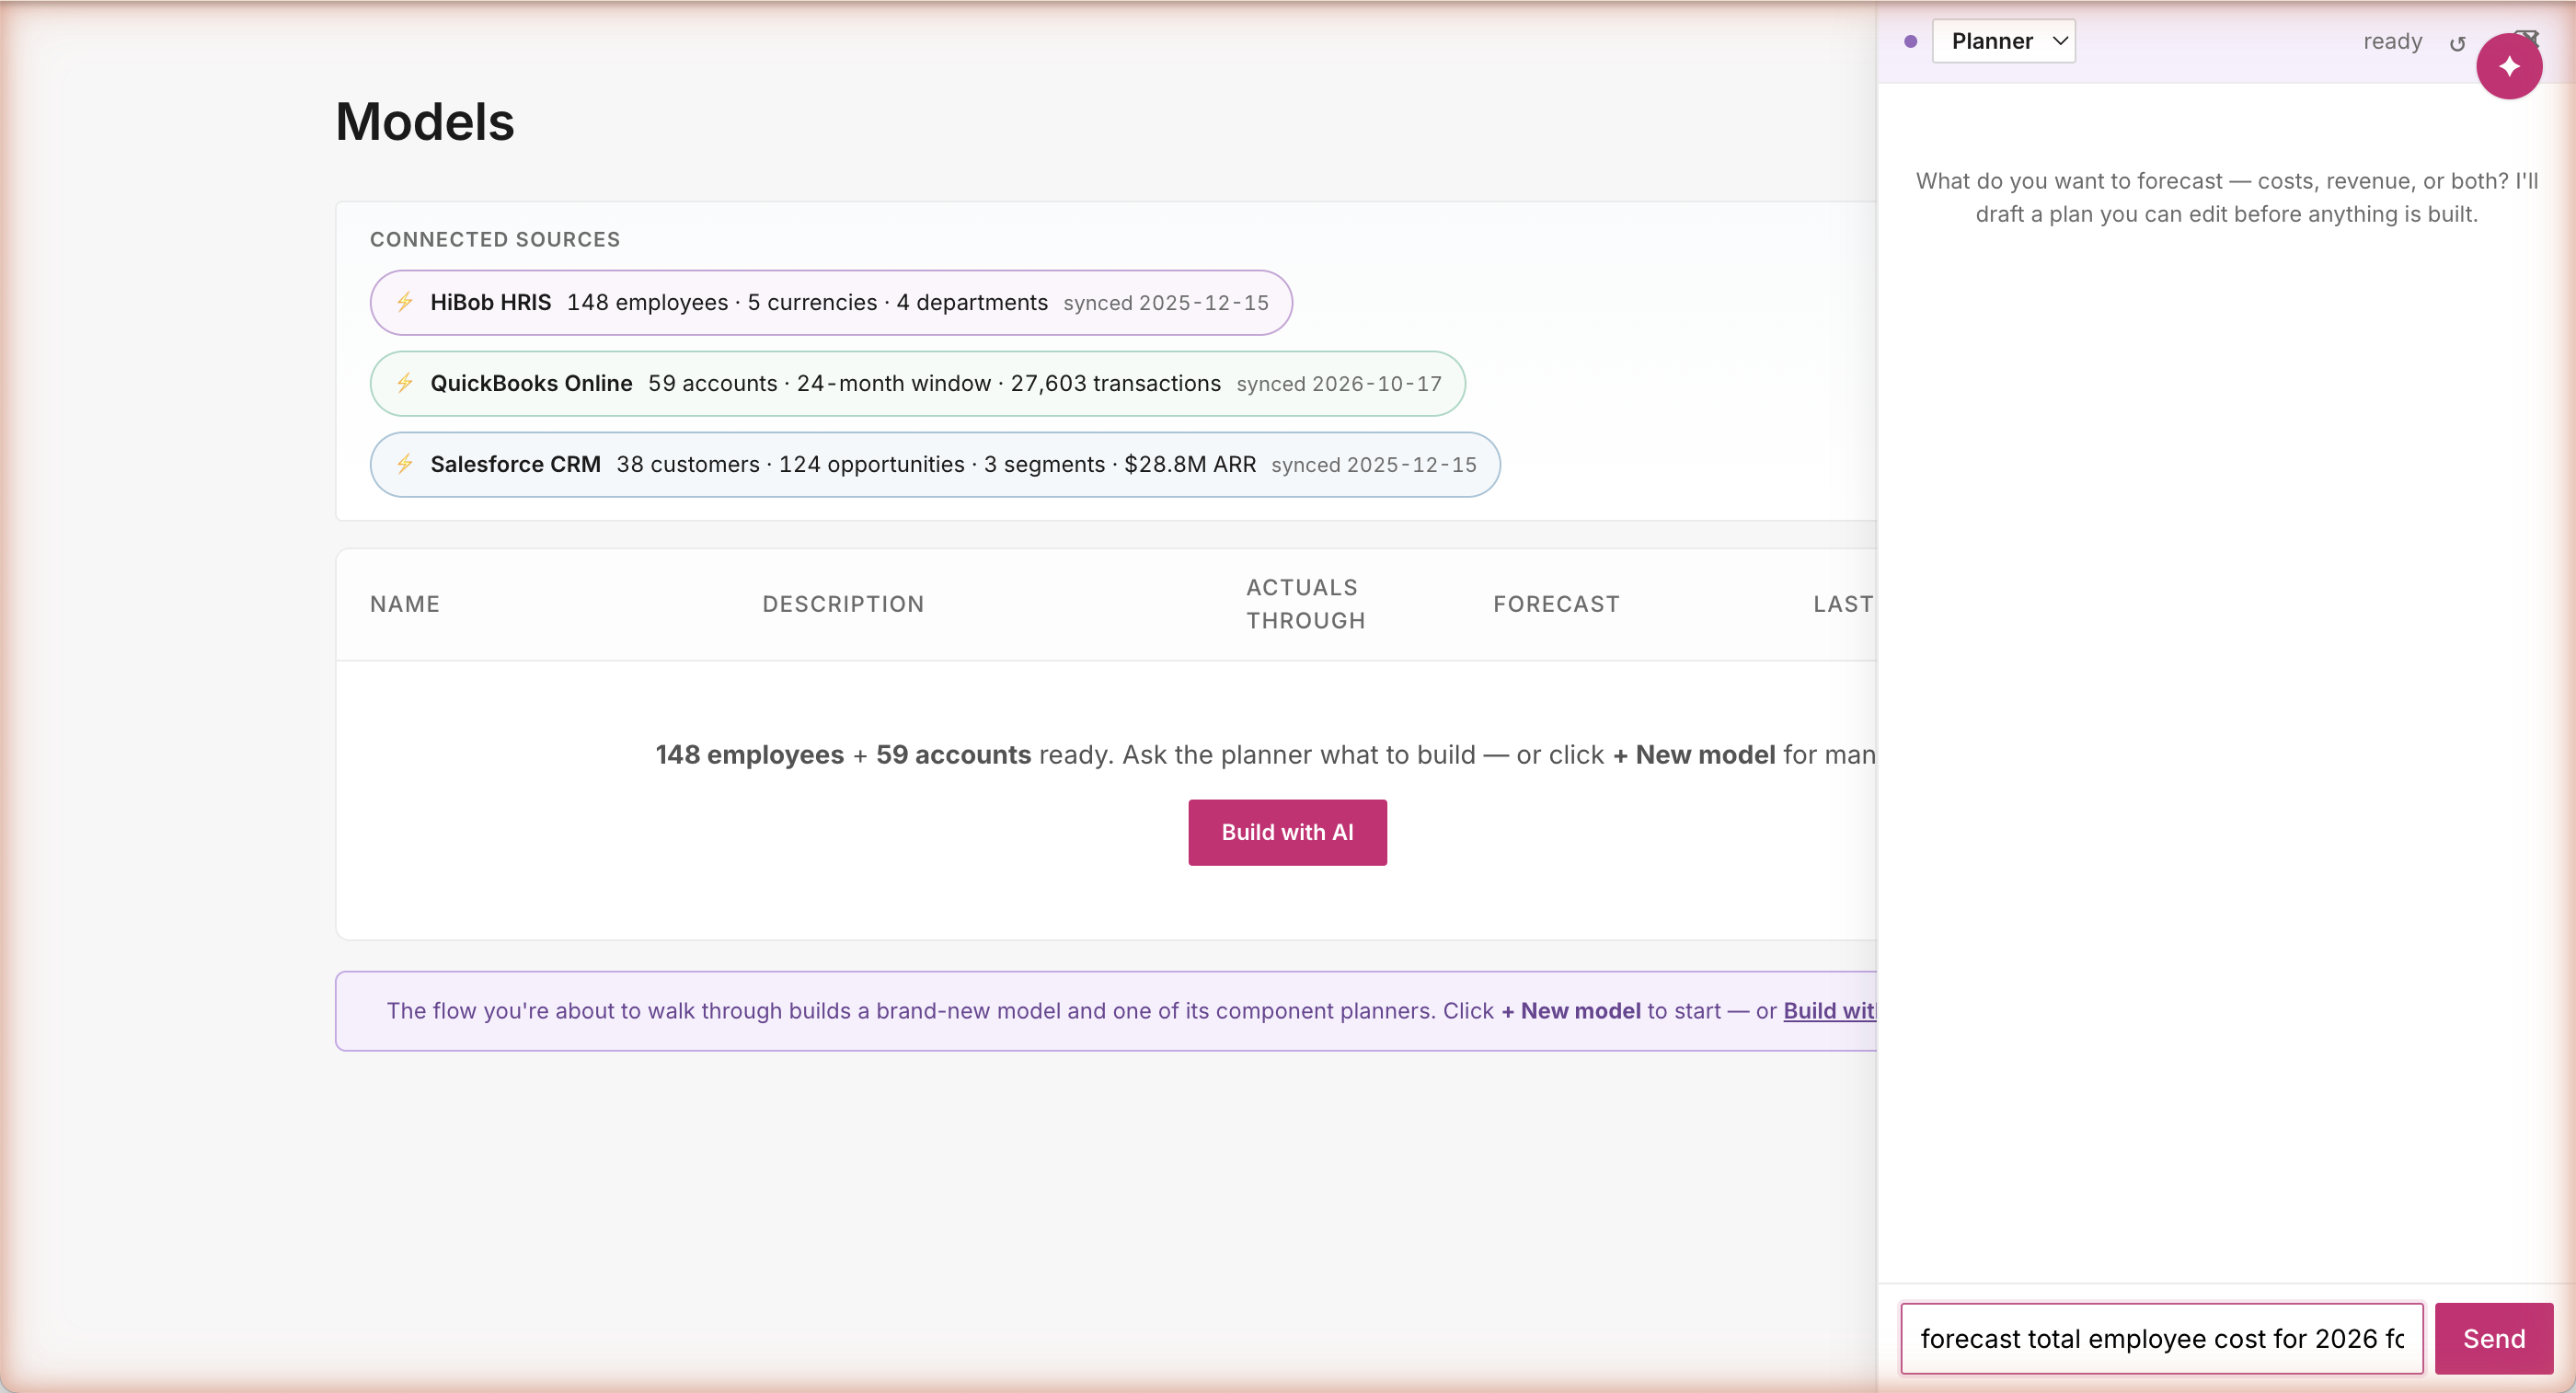
FP&A-fluent. Outcome, not artifact.
Type the question, not the answer
The user types one sentence: "forecast total employee cost for 2026 for existing employees." That's the whole input. They don't tell the agent which assumptions to apply, which dimensions to use, or what formulas to compute. They state an outcome — the way an FP&A leader actually talks. The agent figures out the rest.
Path A · Build · Planner proposes
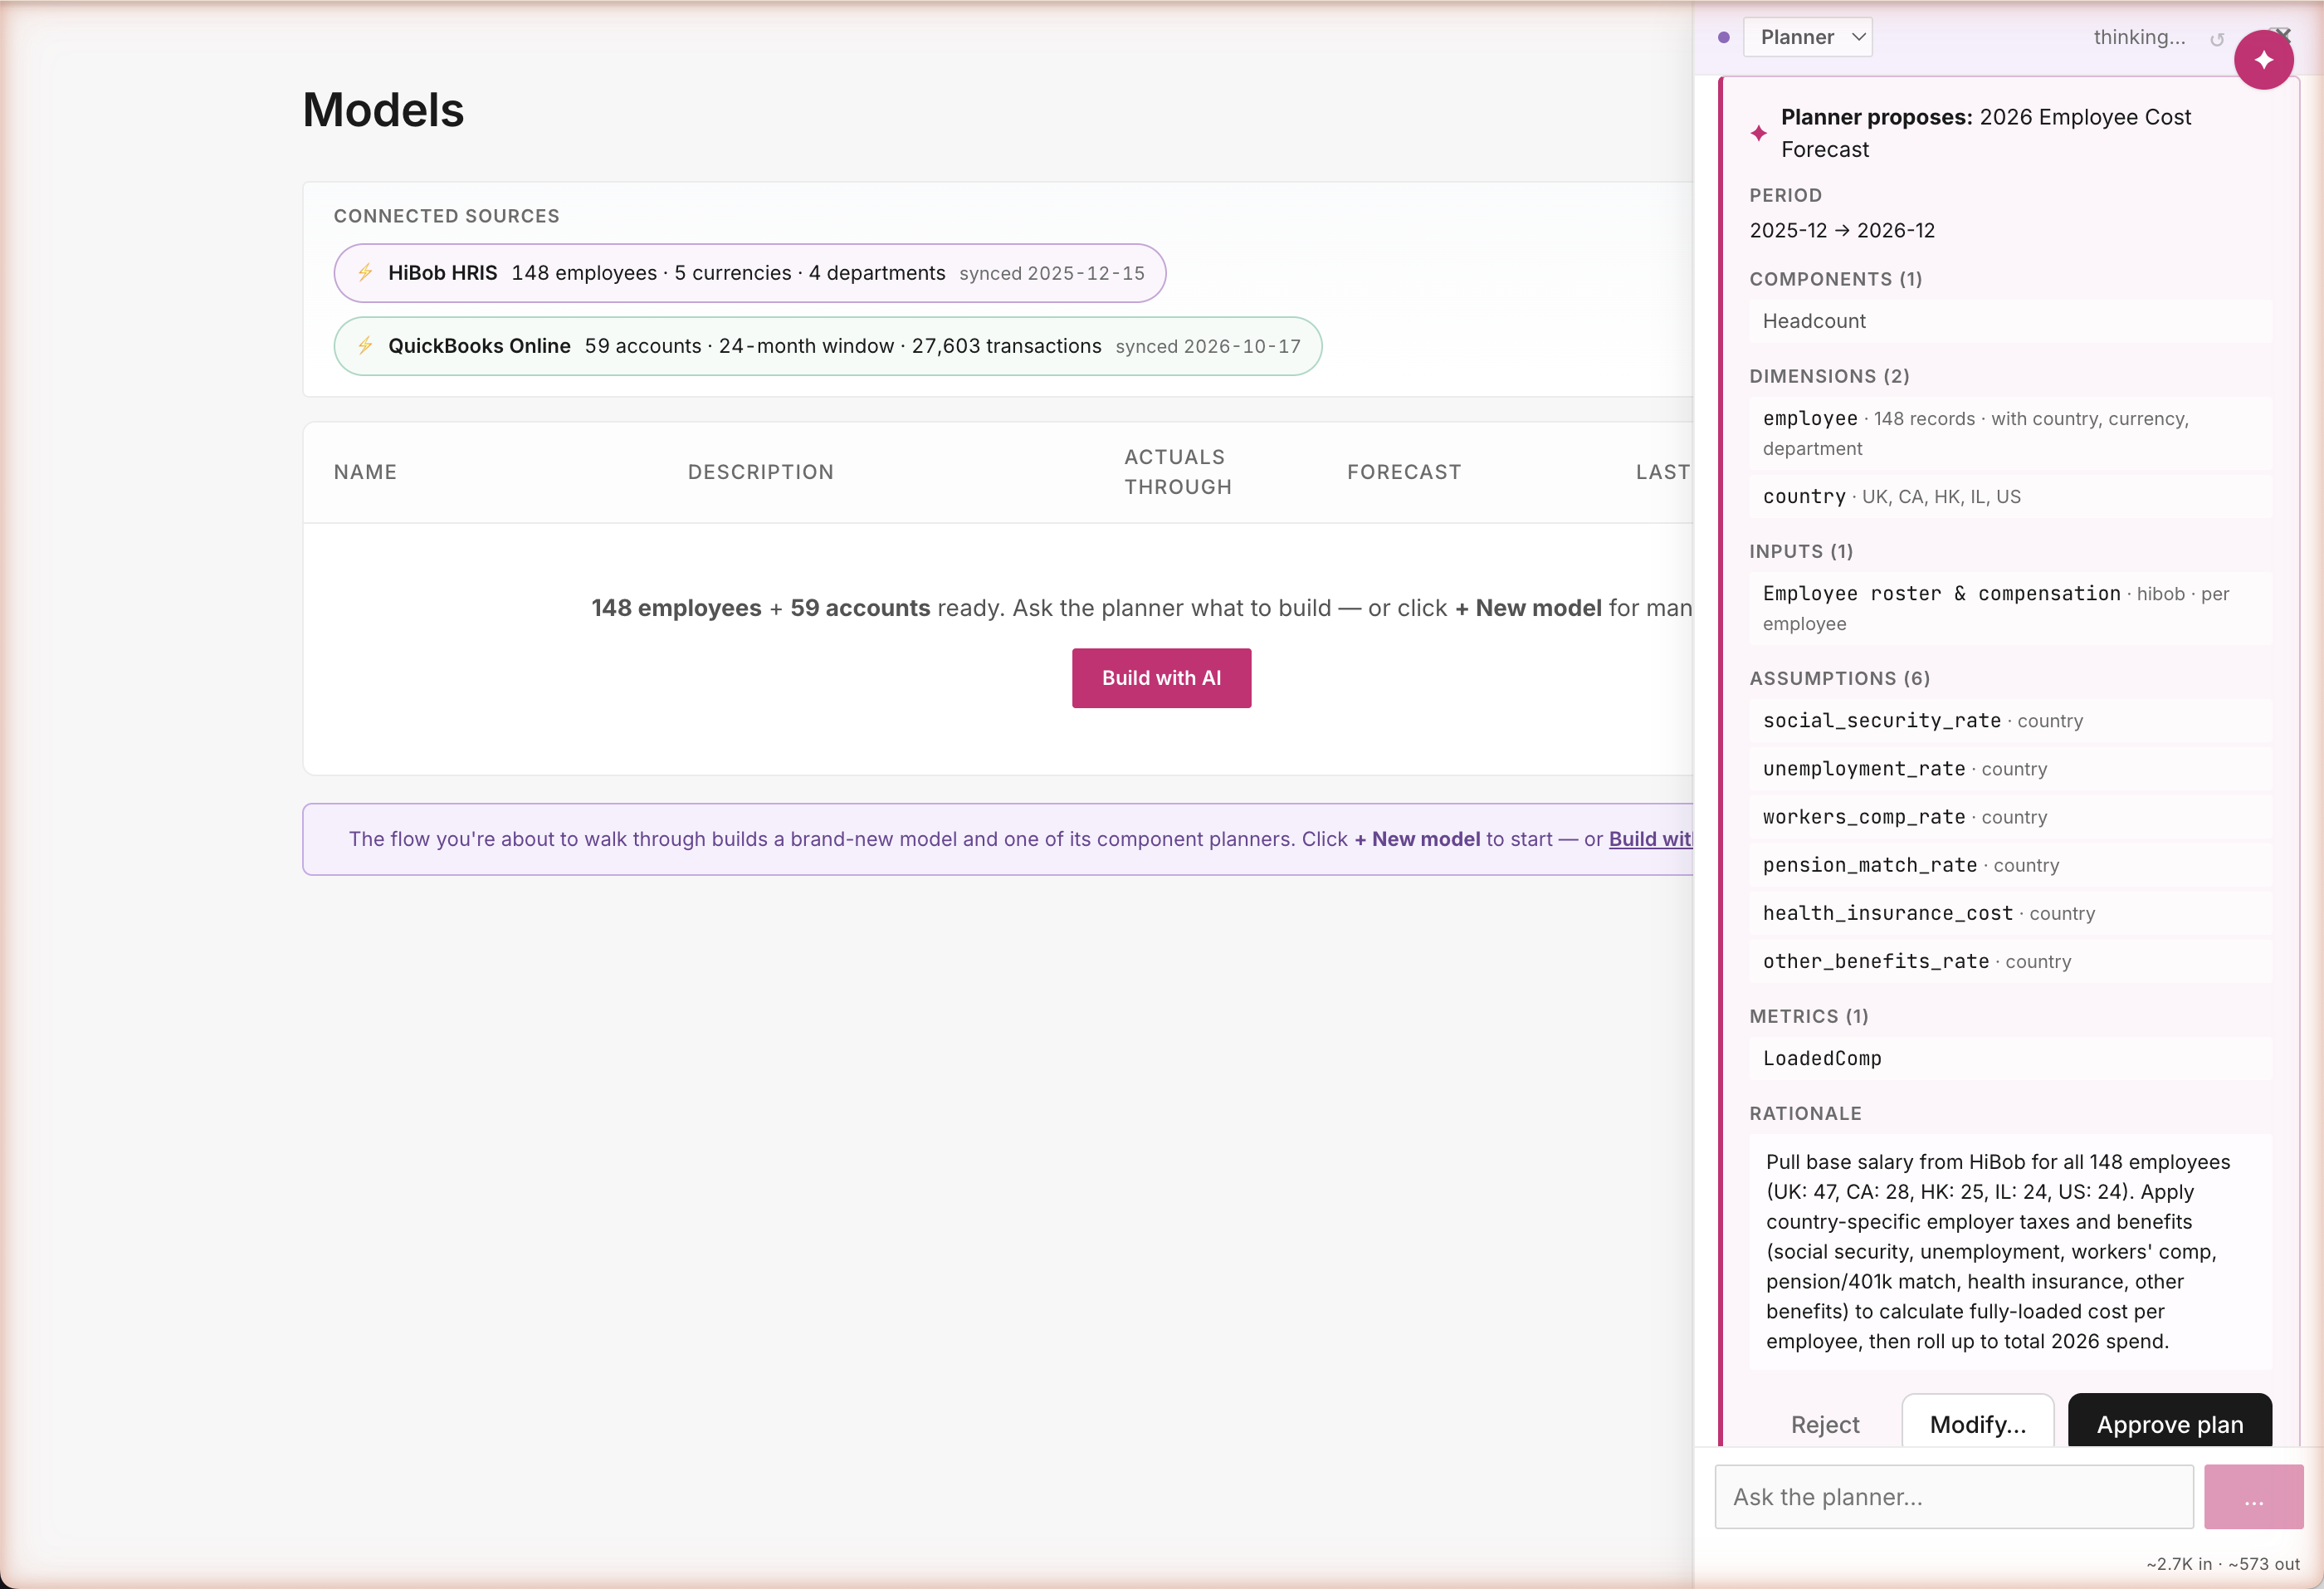
One turn. Zero clarifying questions. Connector-grounded.
Plan first. Build second.
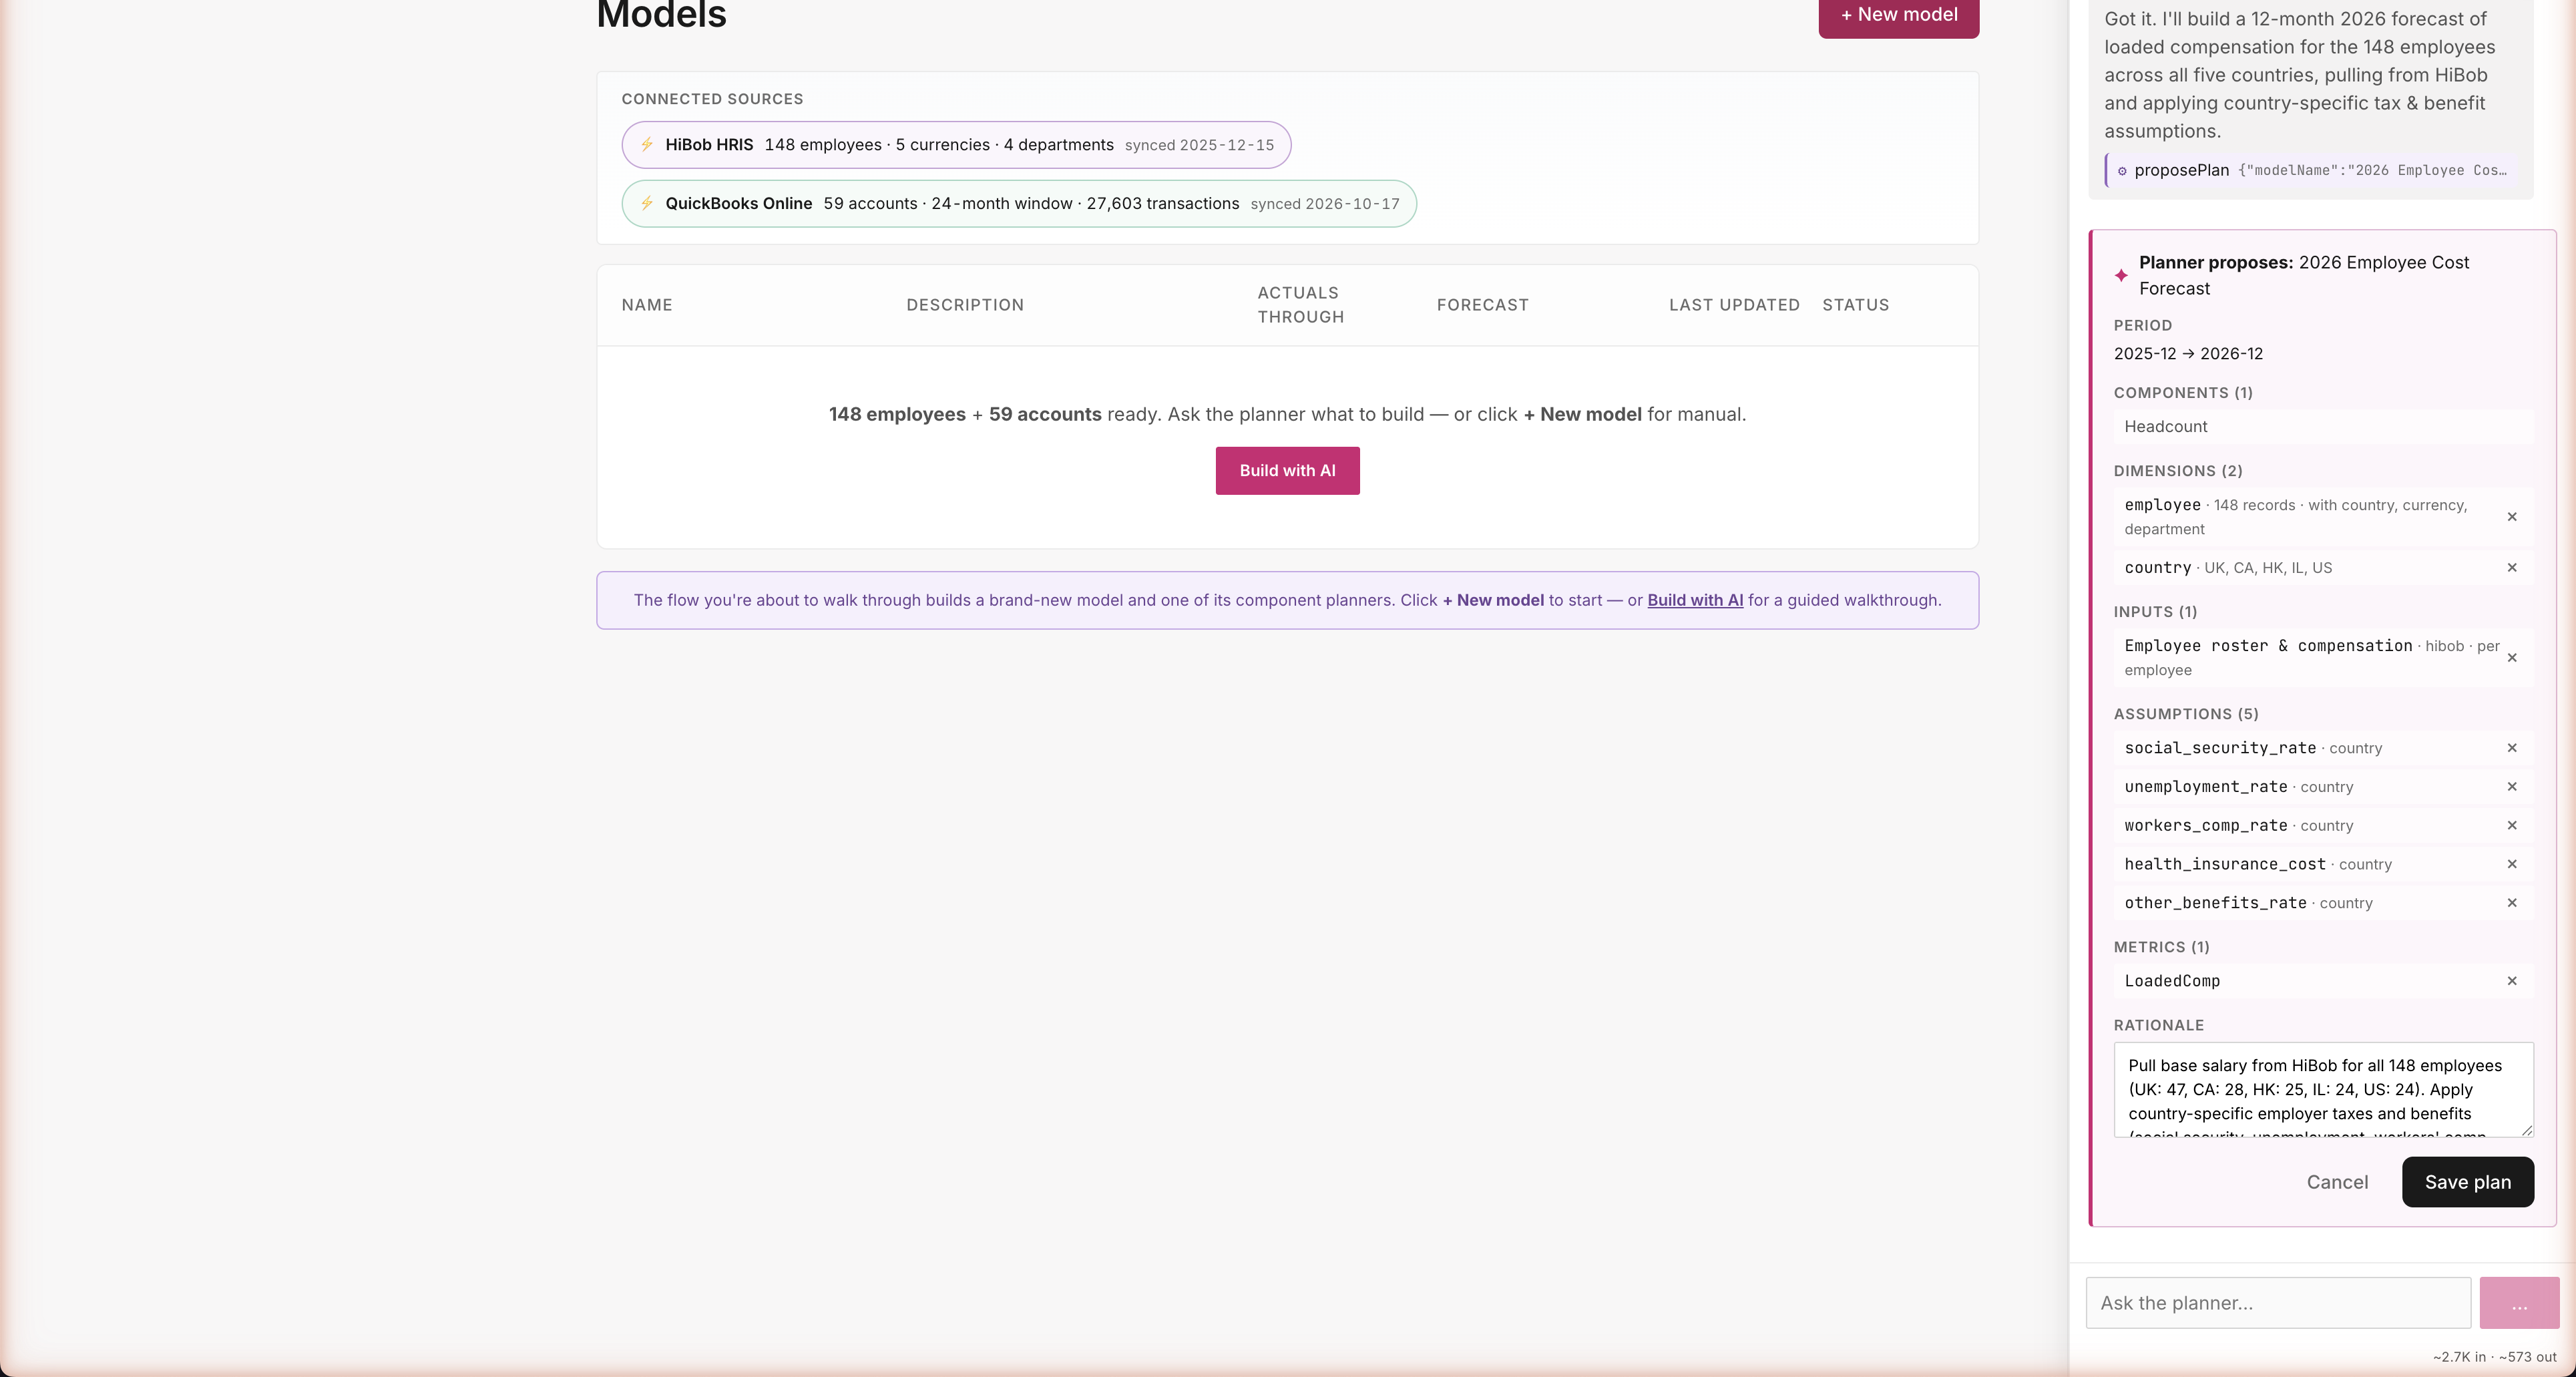
The agent doesn't start mutating data — it shows you a structured proposal. 2026 Employee Cost Forecast: 148 employees broken out by country (UK: 47, CA: 28, HK: 25, IL: 24, US: 24 — real numbers from your HRIS), six country-specific tax and benefits assumptions, and a fully-loaded compensation metric. Every detail comes from real data; nothing's invented. You read it, then decide whether to approve.
Path A · Build · Steer the plan
Modify mode: drop pension_match_rate — Save
You steer · the agent listens
Click Modify and every row gets an × button. Don't 401k-match in this scenario? Drop pension_match_rate, hit Save. The agent now has a contract: build exactly these five things, only these five, no surprises. What you see is what gets built — no silent overrides, no extra assumptions sneaking in.
Path A · Build · How it stays honest
Two synthesized notes. One mechanism.
Injected at session startPR9.2
[CONNECTED SOURCES]
- HiBob HRIS · 148 active employees · synced 2025-12-15
Departments: G&A (48), Engineering (38), Sales & Marketing (37), Customer Success (25)
Currencies: GBP (47), CAD (28), HKD (25), ILS (24), USD (24)
Countries: UK (47), CA (28), HK (25), IL (24), US (24)
- QuickBooks Online · 59 accounts · 24 months actuals
Subsidiaries: Consolidated, Demo USA, Demo Canada
27,603 transactions in window
Use these sources by default. Do not ask "what data source?" if a source is listed. Do not hallucinate connectors not in this list.
Injected on Planner→BuilderPR9.1
[APPROVED PLAN] — authoritative source of truth.
Do not add entities outside this list. Do not skip entities in this list. Do NOT fall back to COMPONENT_CATALOG enumeration.
{
"modelName": "2026 Employee Cost Forecast",
"period": { "actualsThrough": "2025-12", "forecastEnd": "2026-12" },
"dimensions": [
{ "name": "employee", "count": 148, "attrs": [...] },
{ "name": "country", "values": ["UK","CA","HK","IL","US"] }
],
"inputs": [{ "name":"employees", "connector":"hibob" }],
"assumptions": [...5 entries (pension_match_rate dropped)...]
}
How the agent stays honest
Two structured notes get injected behind the scenes — they're how the agent knows the rules. CONNECTED SOURCES tells it what data exists (148 HiBob employees, 5 currencies, 4 departments). APPROVED PLAN tells it exactly what the user just approved. Together they prevent the two failure modes of generic AI: hallucinating data sources, and ignoring user modifications.
Path A · Build · Builder executes
16 builder actions, no re-prompts. Real connector data.
One approval. Sixteen actions. No popups.
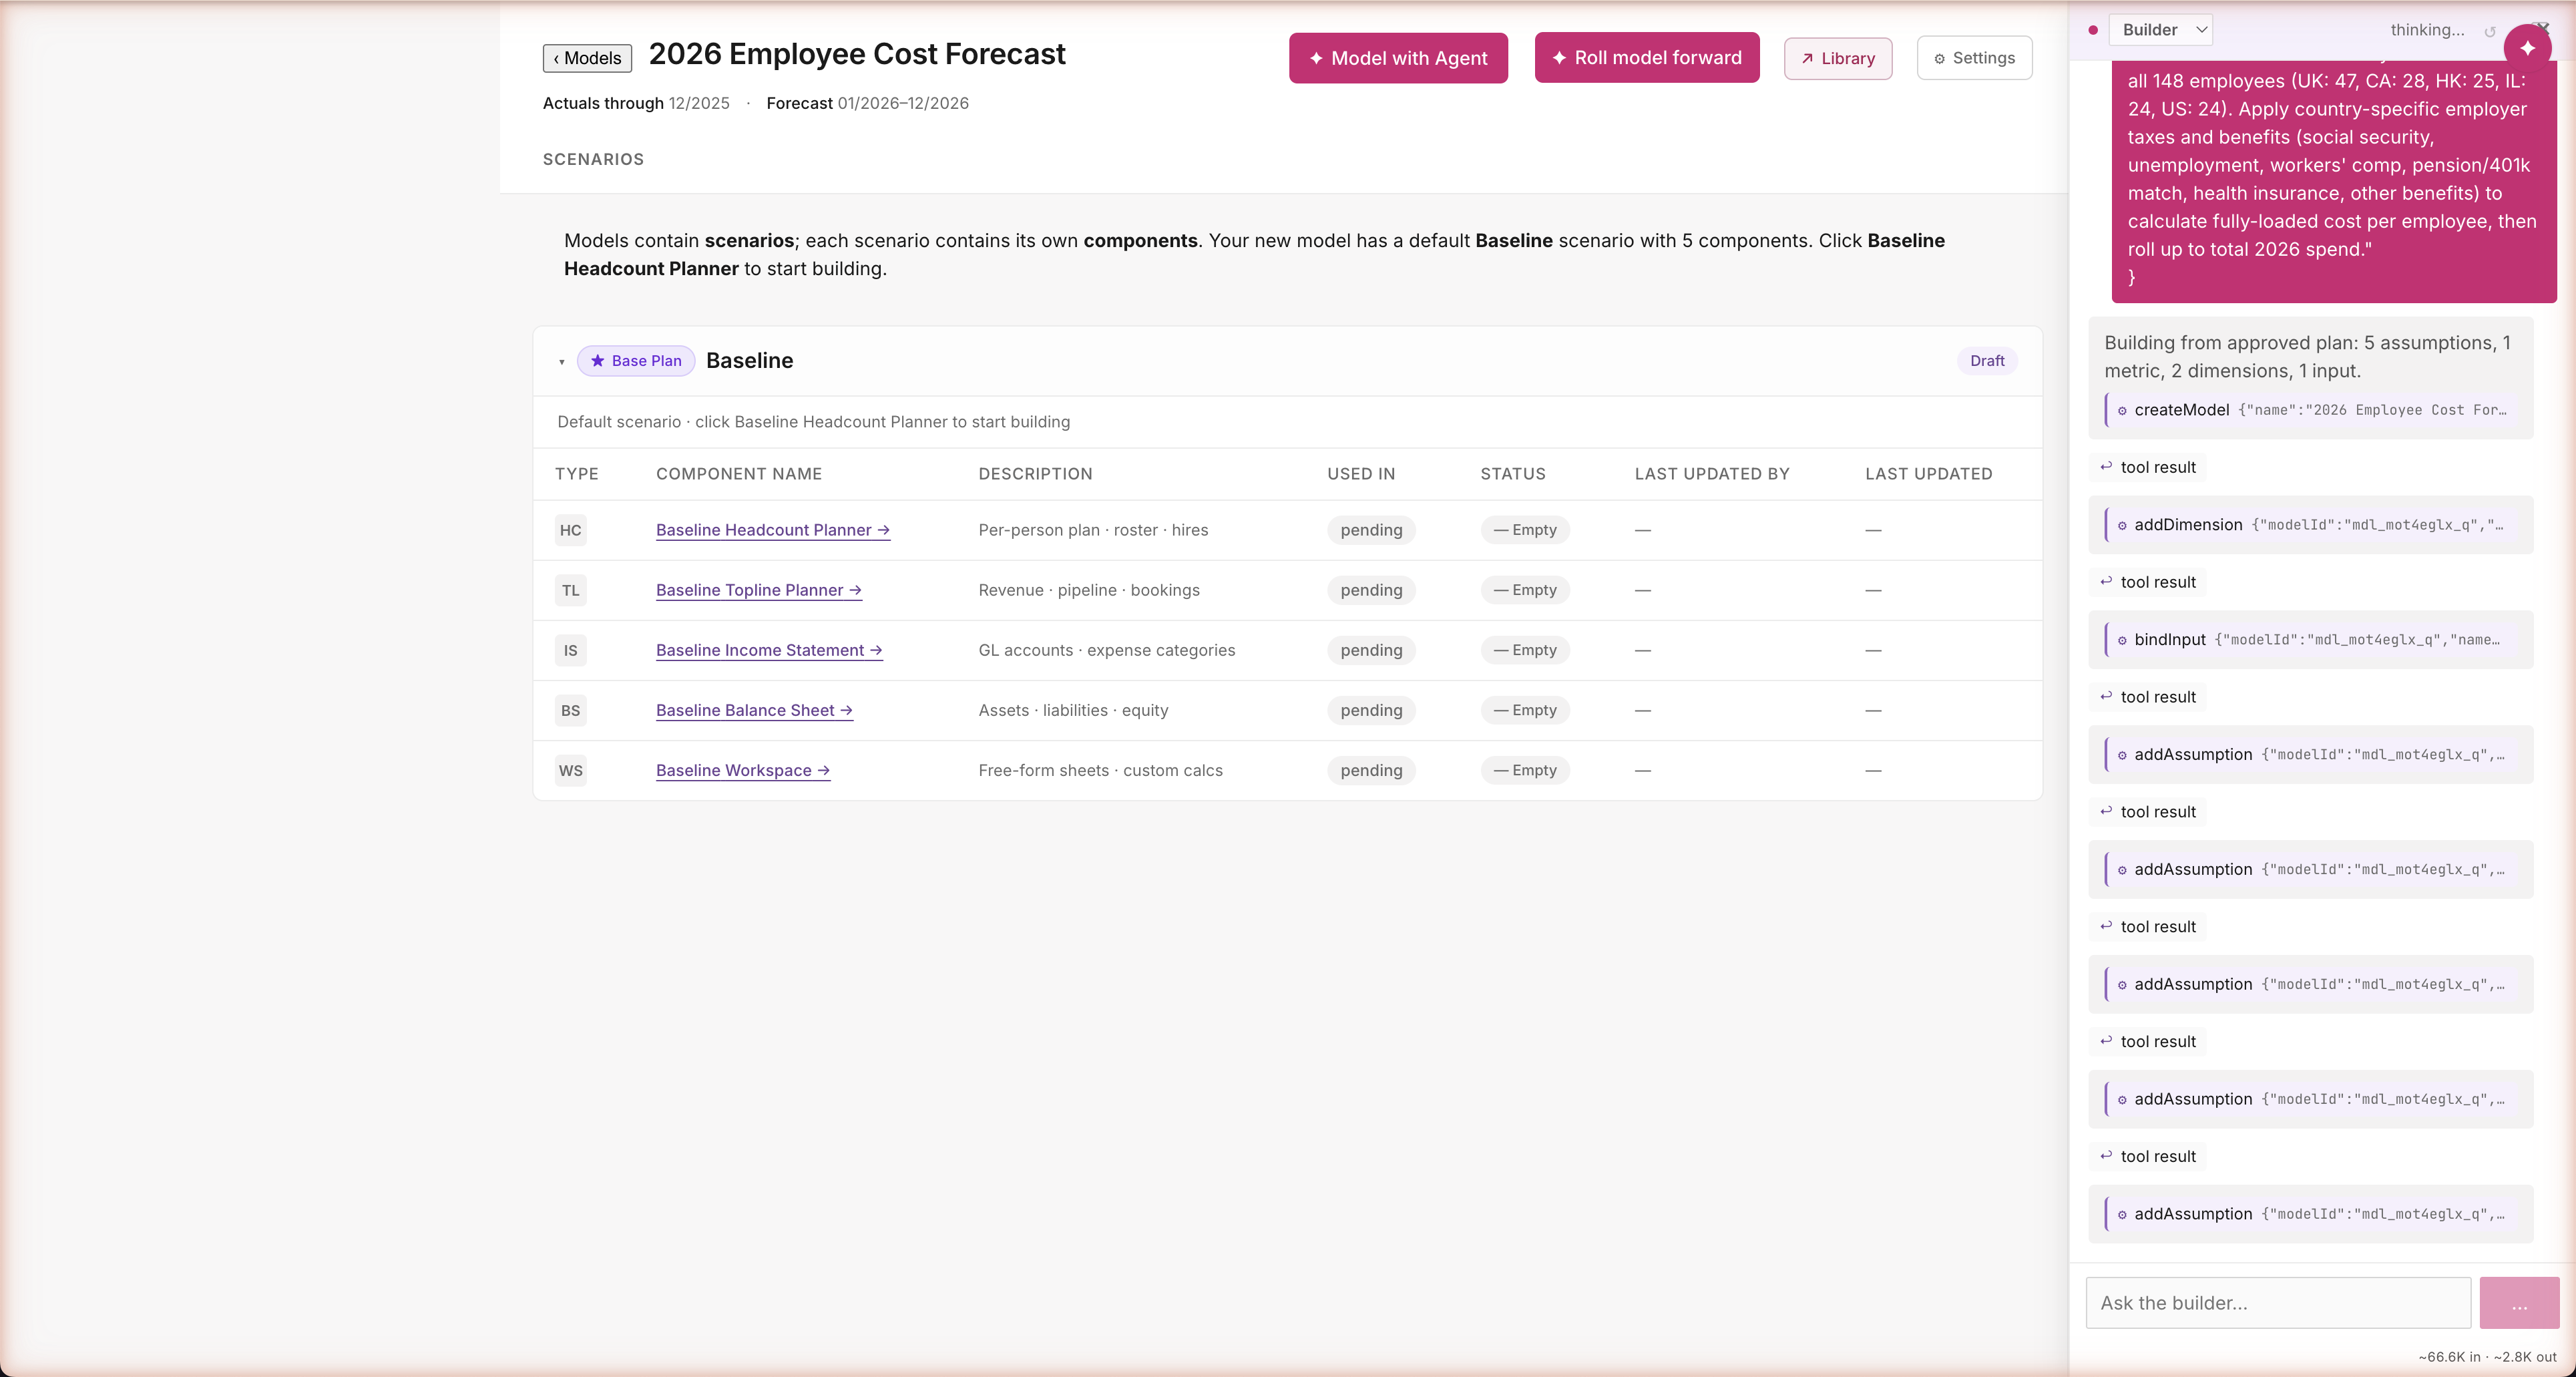
The agent runs sixteen actions in a few seconds — creates the model, defines dimensions, binds inputs from HiBob, registers all five assumptions with country-specific values, builds the LoadedComp formula. Every action visible in the chat as an audit trail. Most AI agents would ask "are you sure?" before each step; this one asked once at the right altitude (the plan) and respects that decision through every step that follows.
Path A · Build · Analyst closes
Closes with connector-grounded specifics
Real numbers, real sources
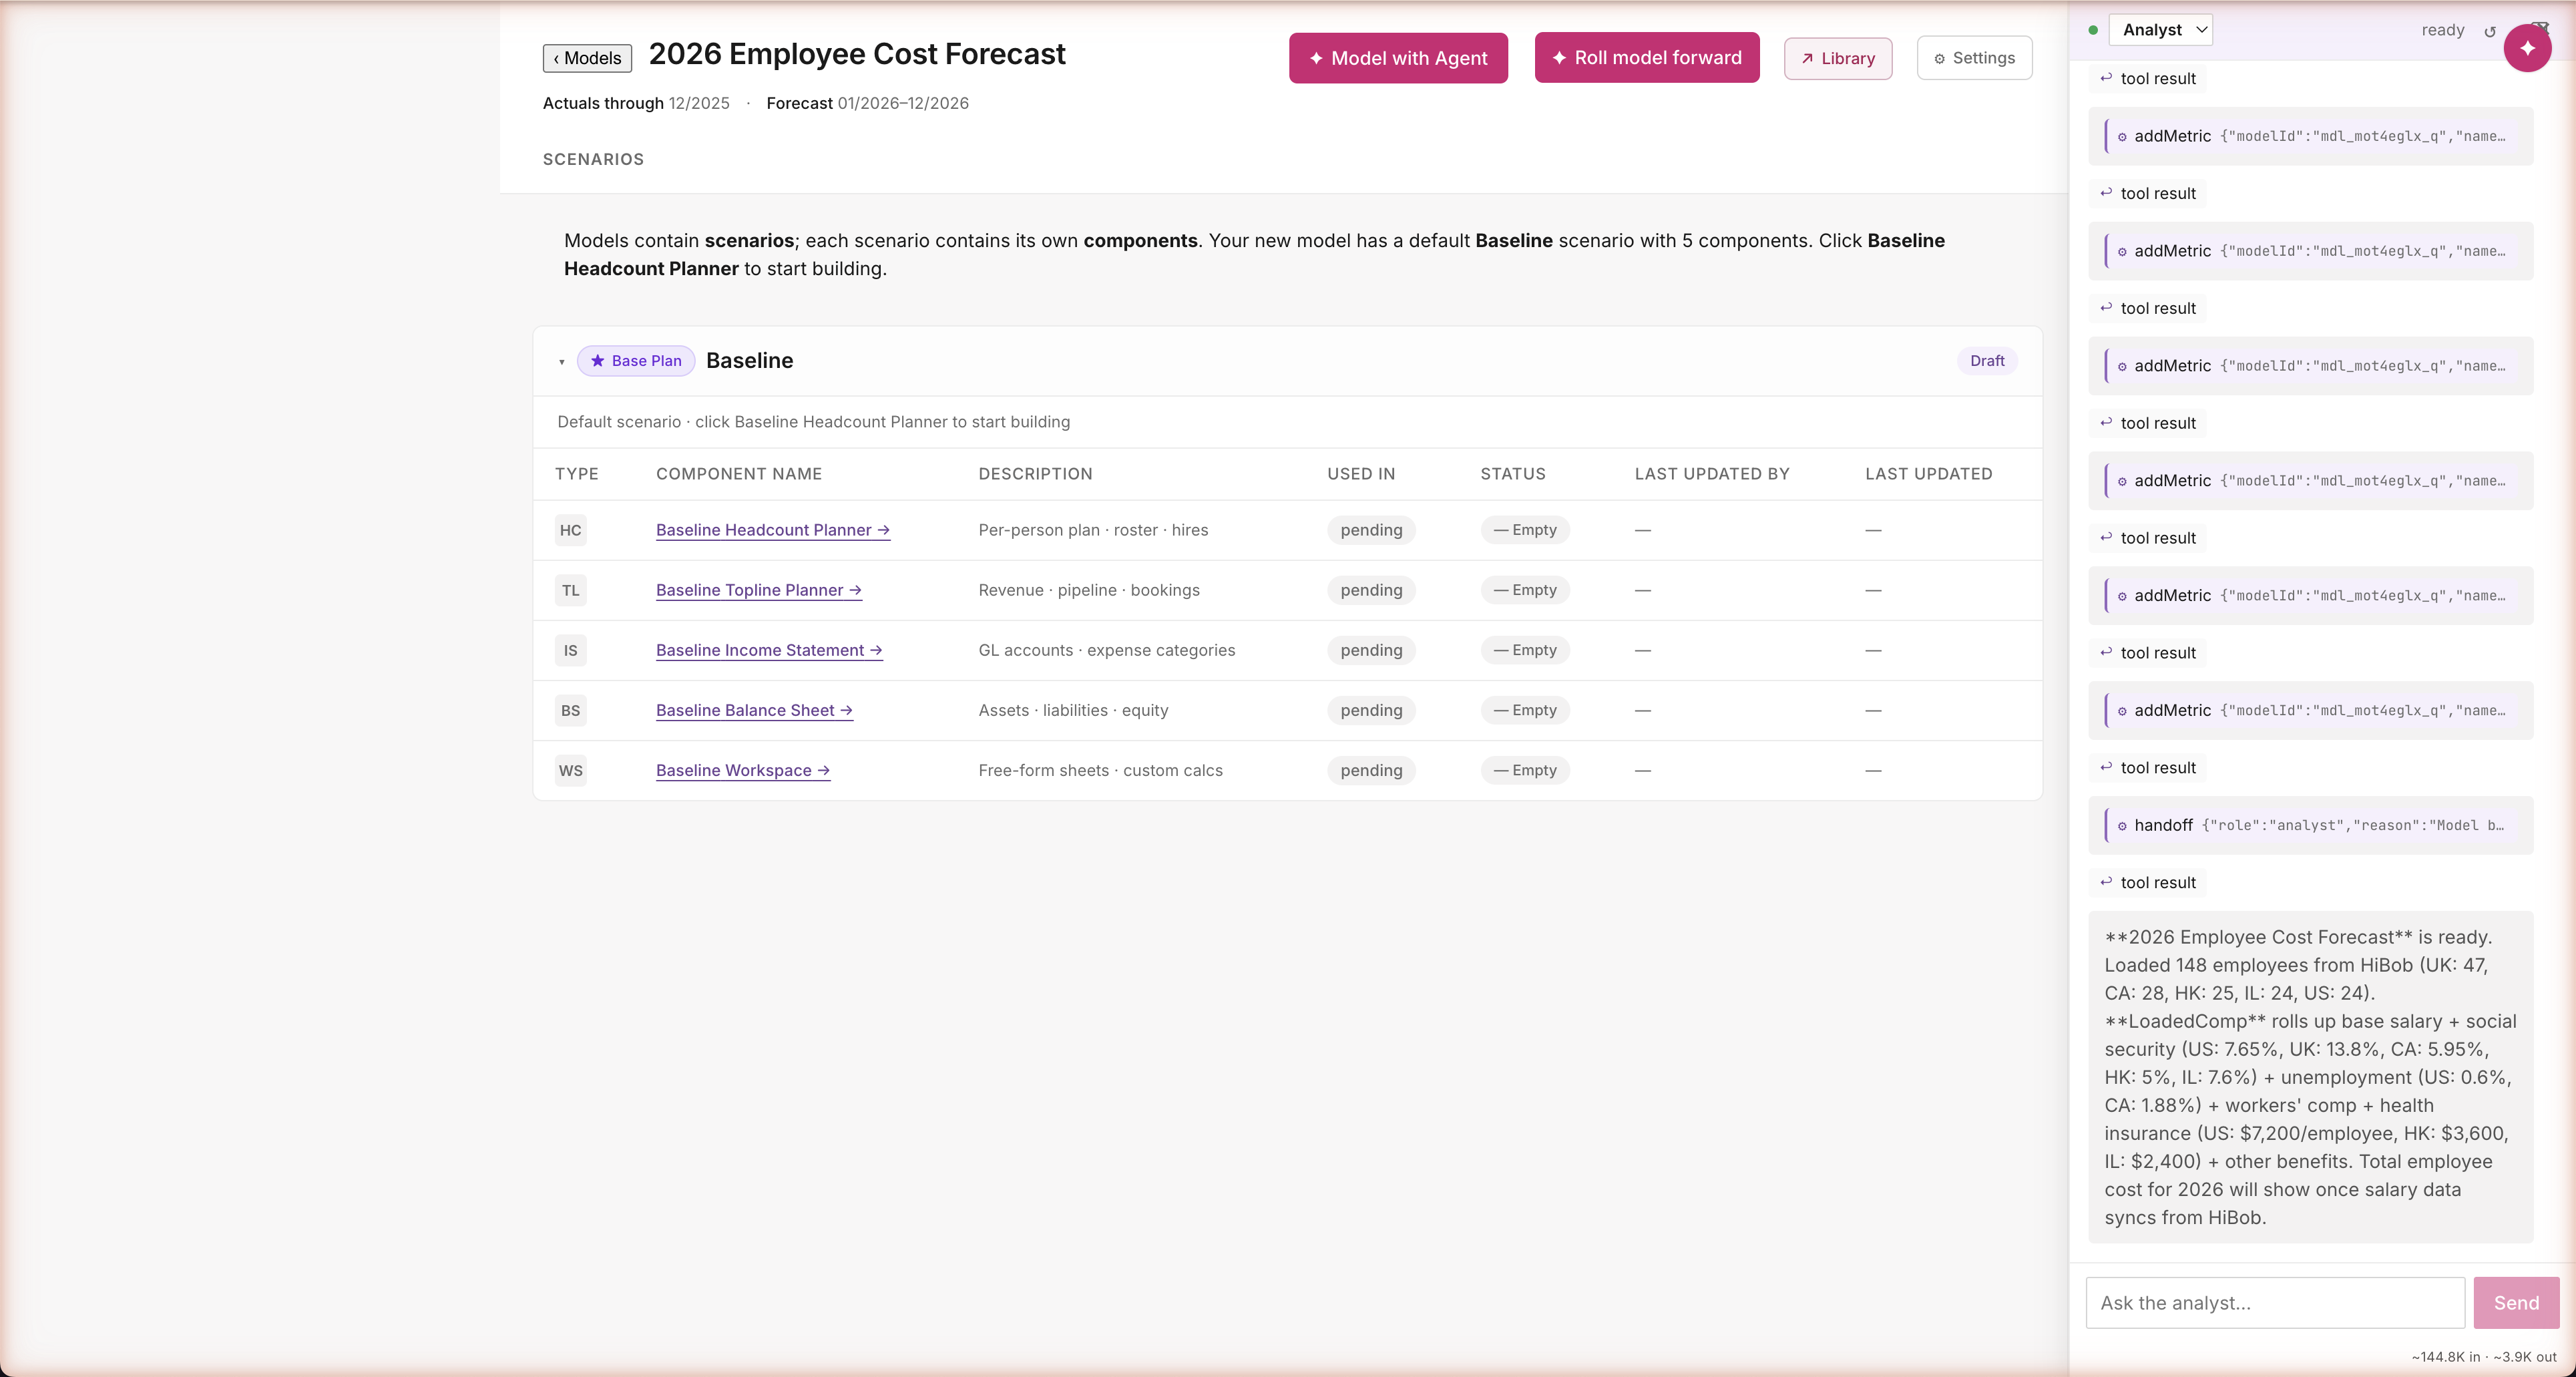
The agent closes by walking you through what it built — country-by-country tax rates, region-specific benefits, all sourced from the approved plan. "Social security 7.65% US, 13.8% UK, 5.95% CA. Health insurance $7,200/employee US, $3,600 HK, $2,400 IL." Five minutes of work, one finished model. Numbers you can defend in a board meeting because they trace back to real benchmarks (IRS, SHRM, Vanguard, Carta) — not guessed by an AI.
Path A · Build · Library state
What got built. Exactly the modified plan.
Proof the modification stuck
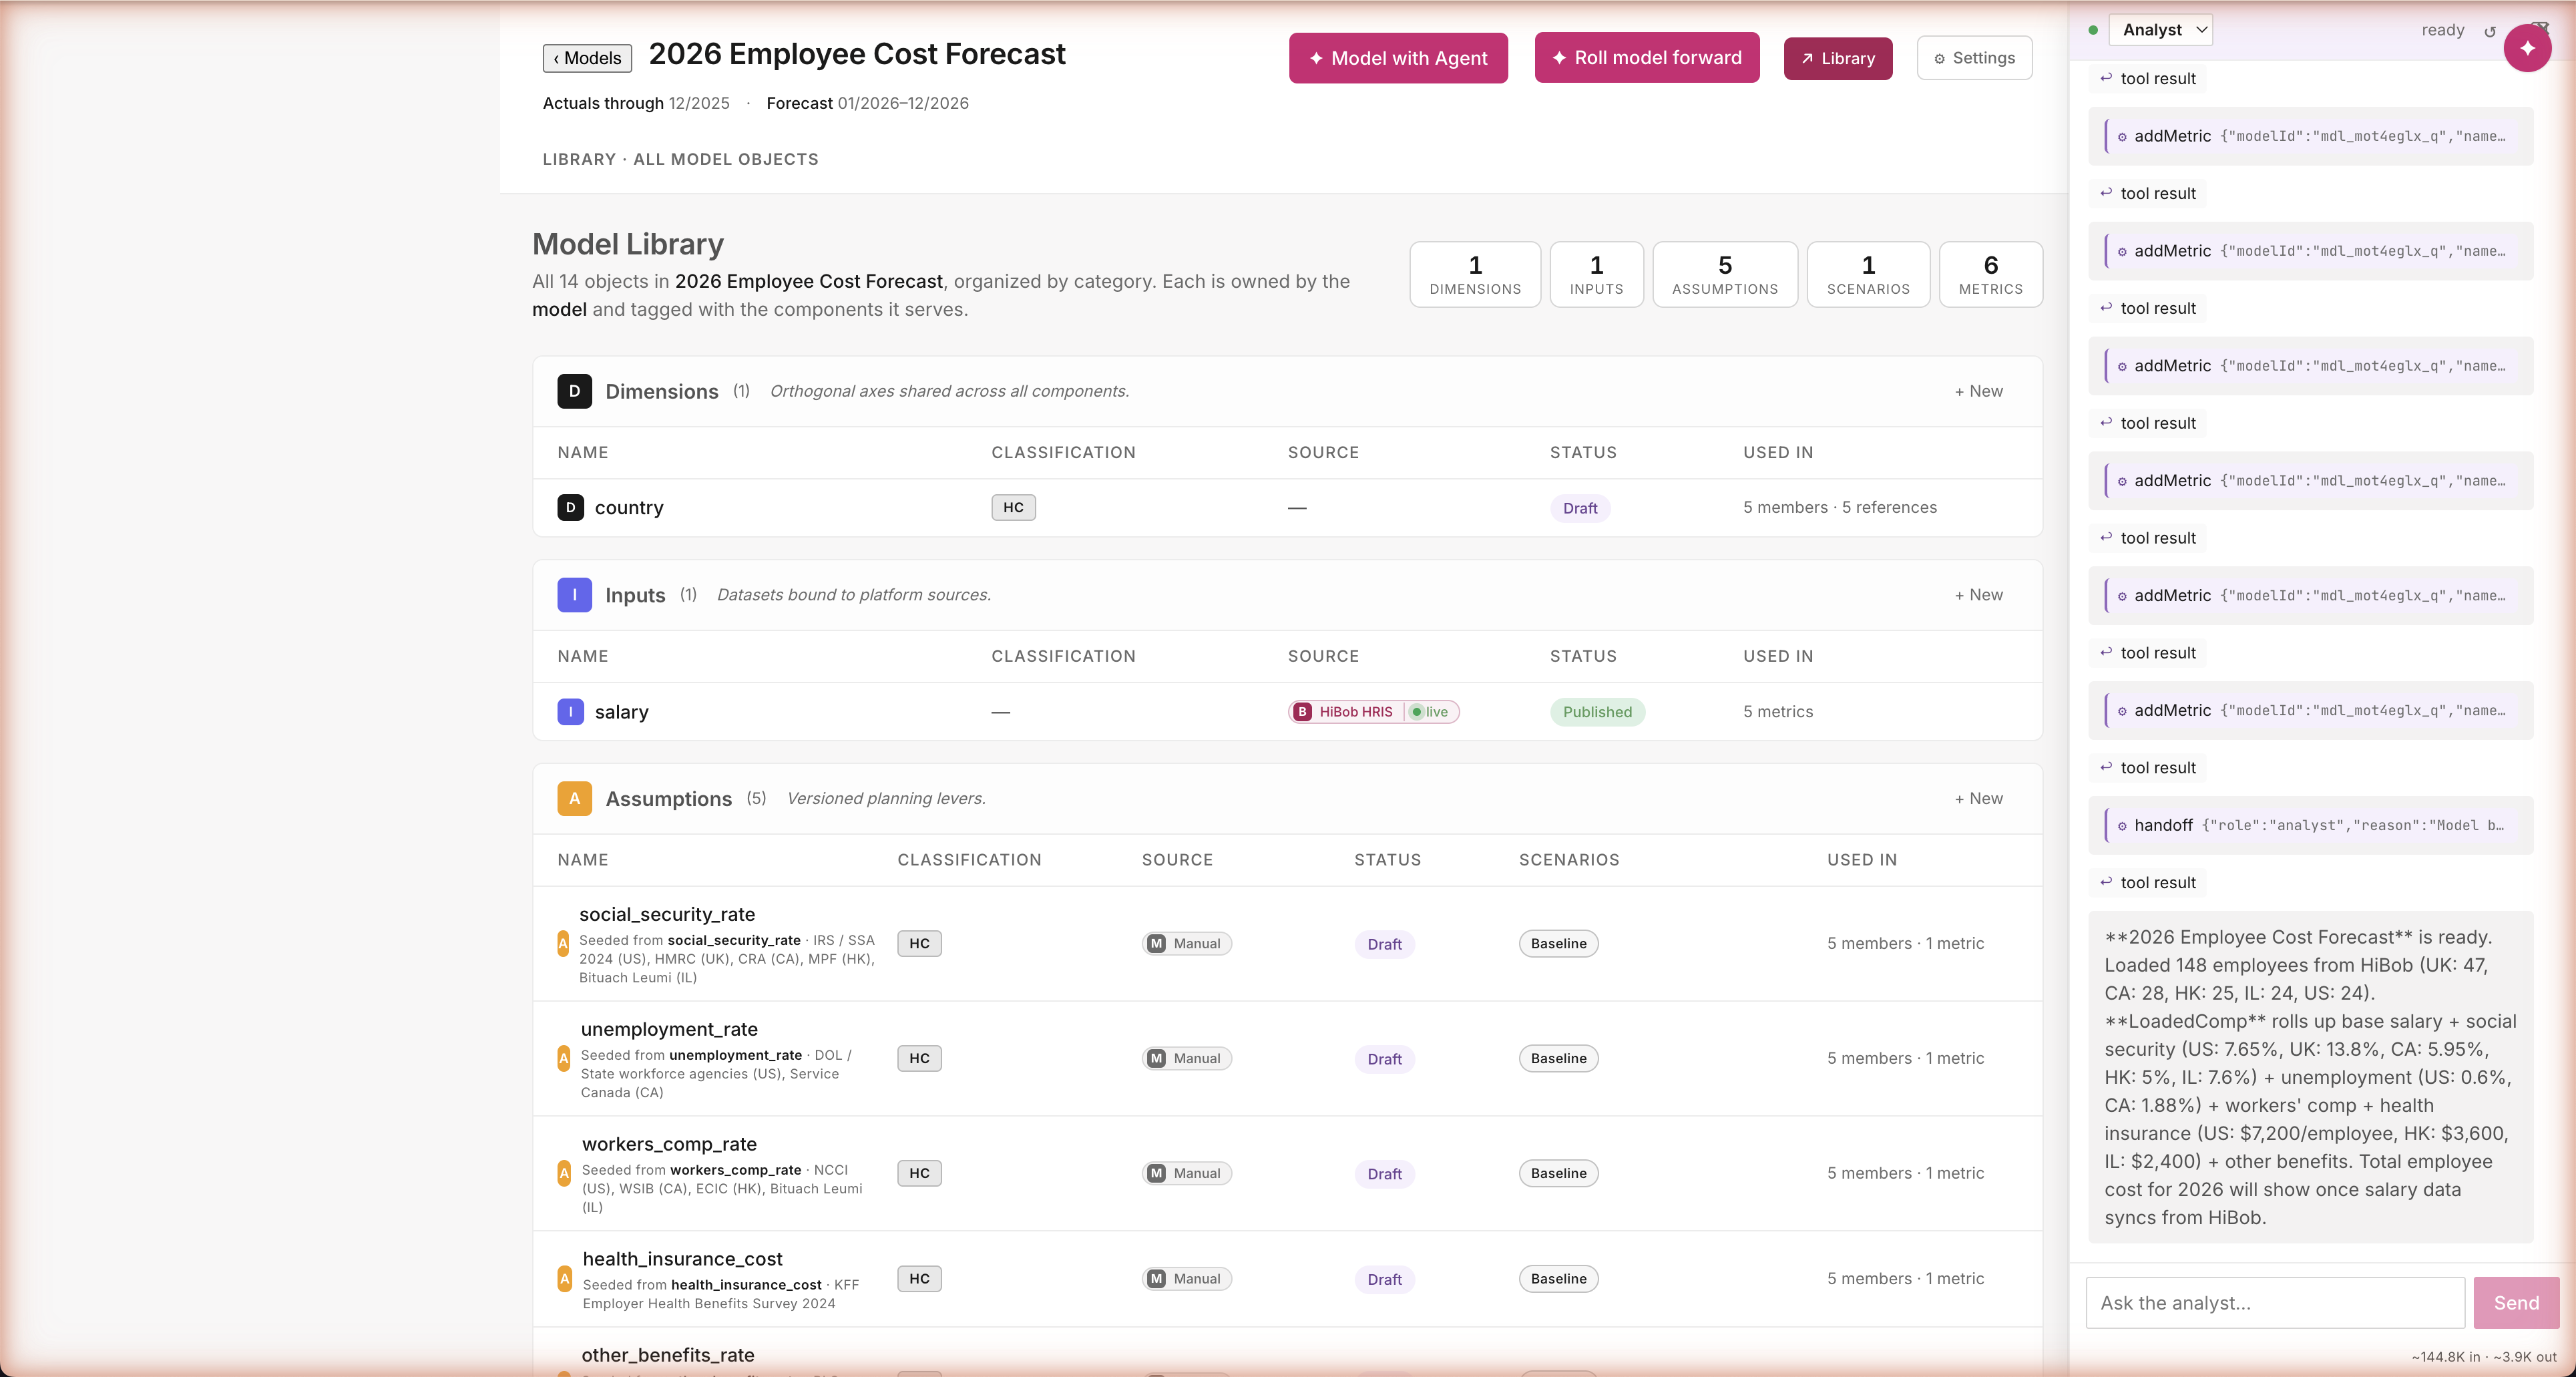
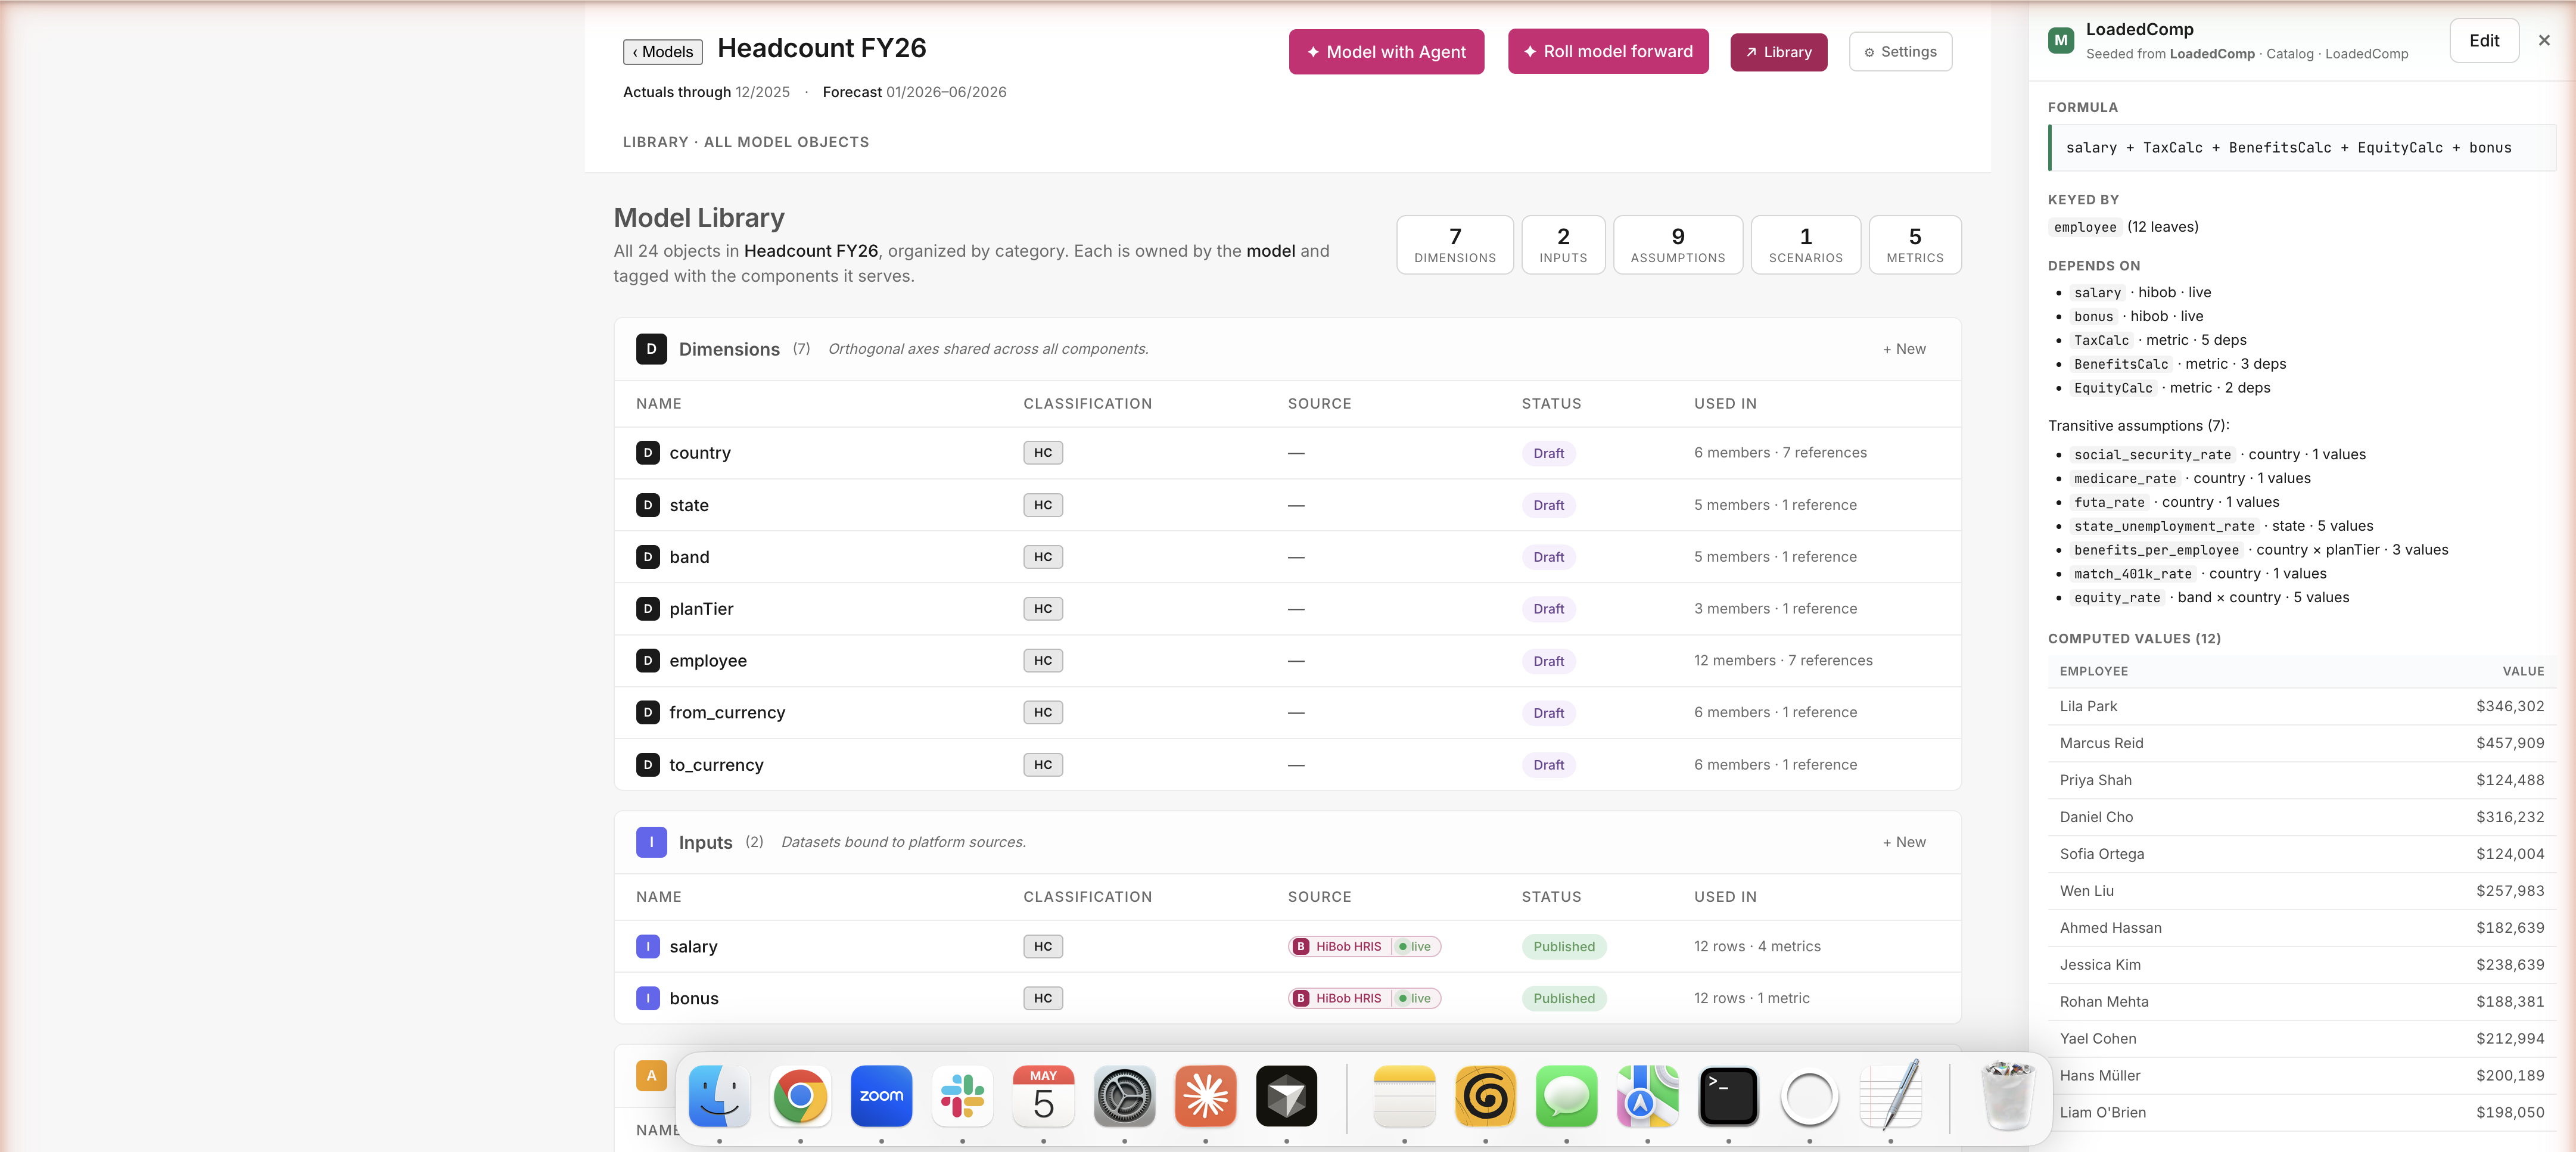
Open the Library and you see exactly the five assumptions you approved. No pension_match_rate anywhere — the agent honored the modify. Each assumption shows its source (HiBob for live data; IRS, SHRM, Vanguard for benchmarks), what it's keyed by (country, with five values), and where it's used. Audit-grade trust for an AI workflow — every number's source is right there in the UI, not buried in a chat transcript.
Path A · Build · The plan, ready to use
Headcount Planner — the sheet the user lands on
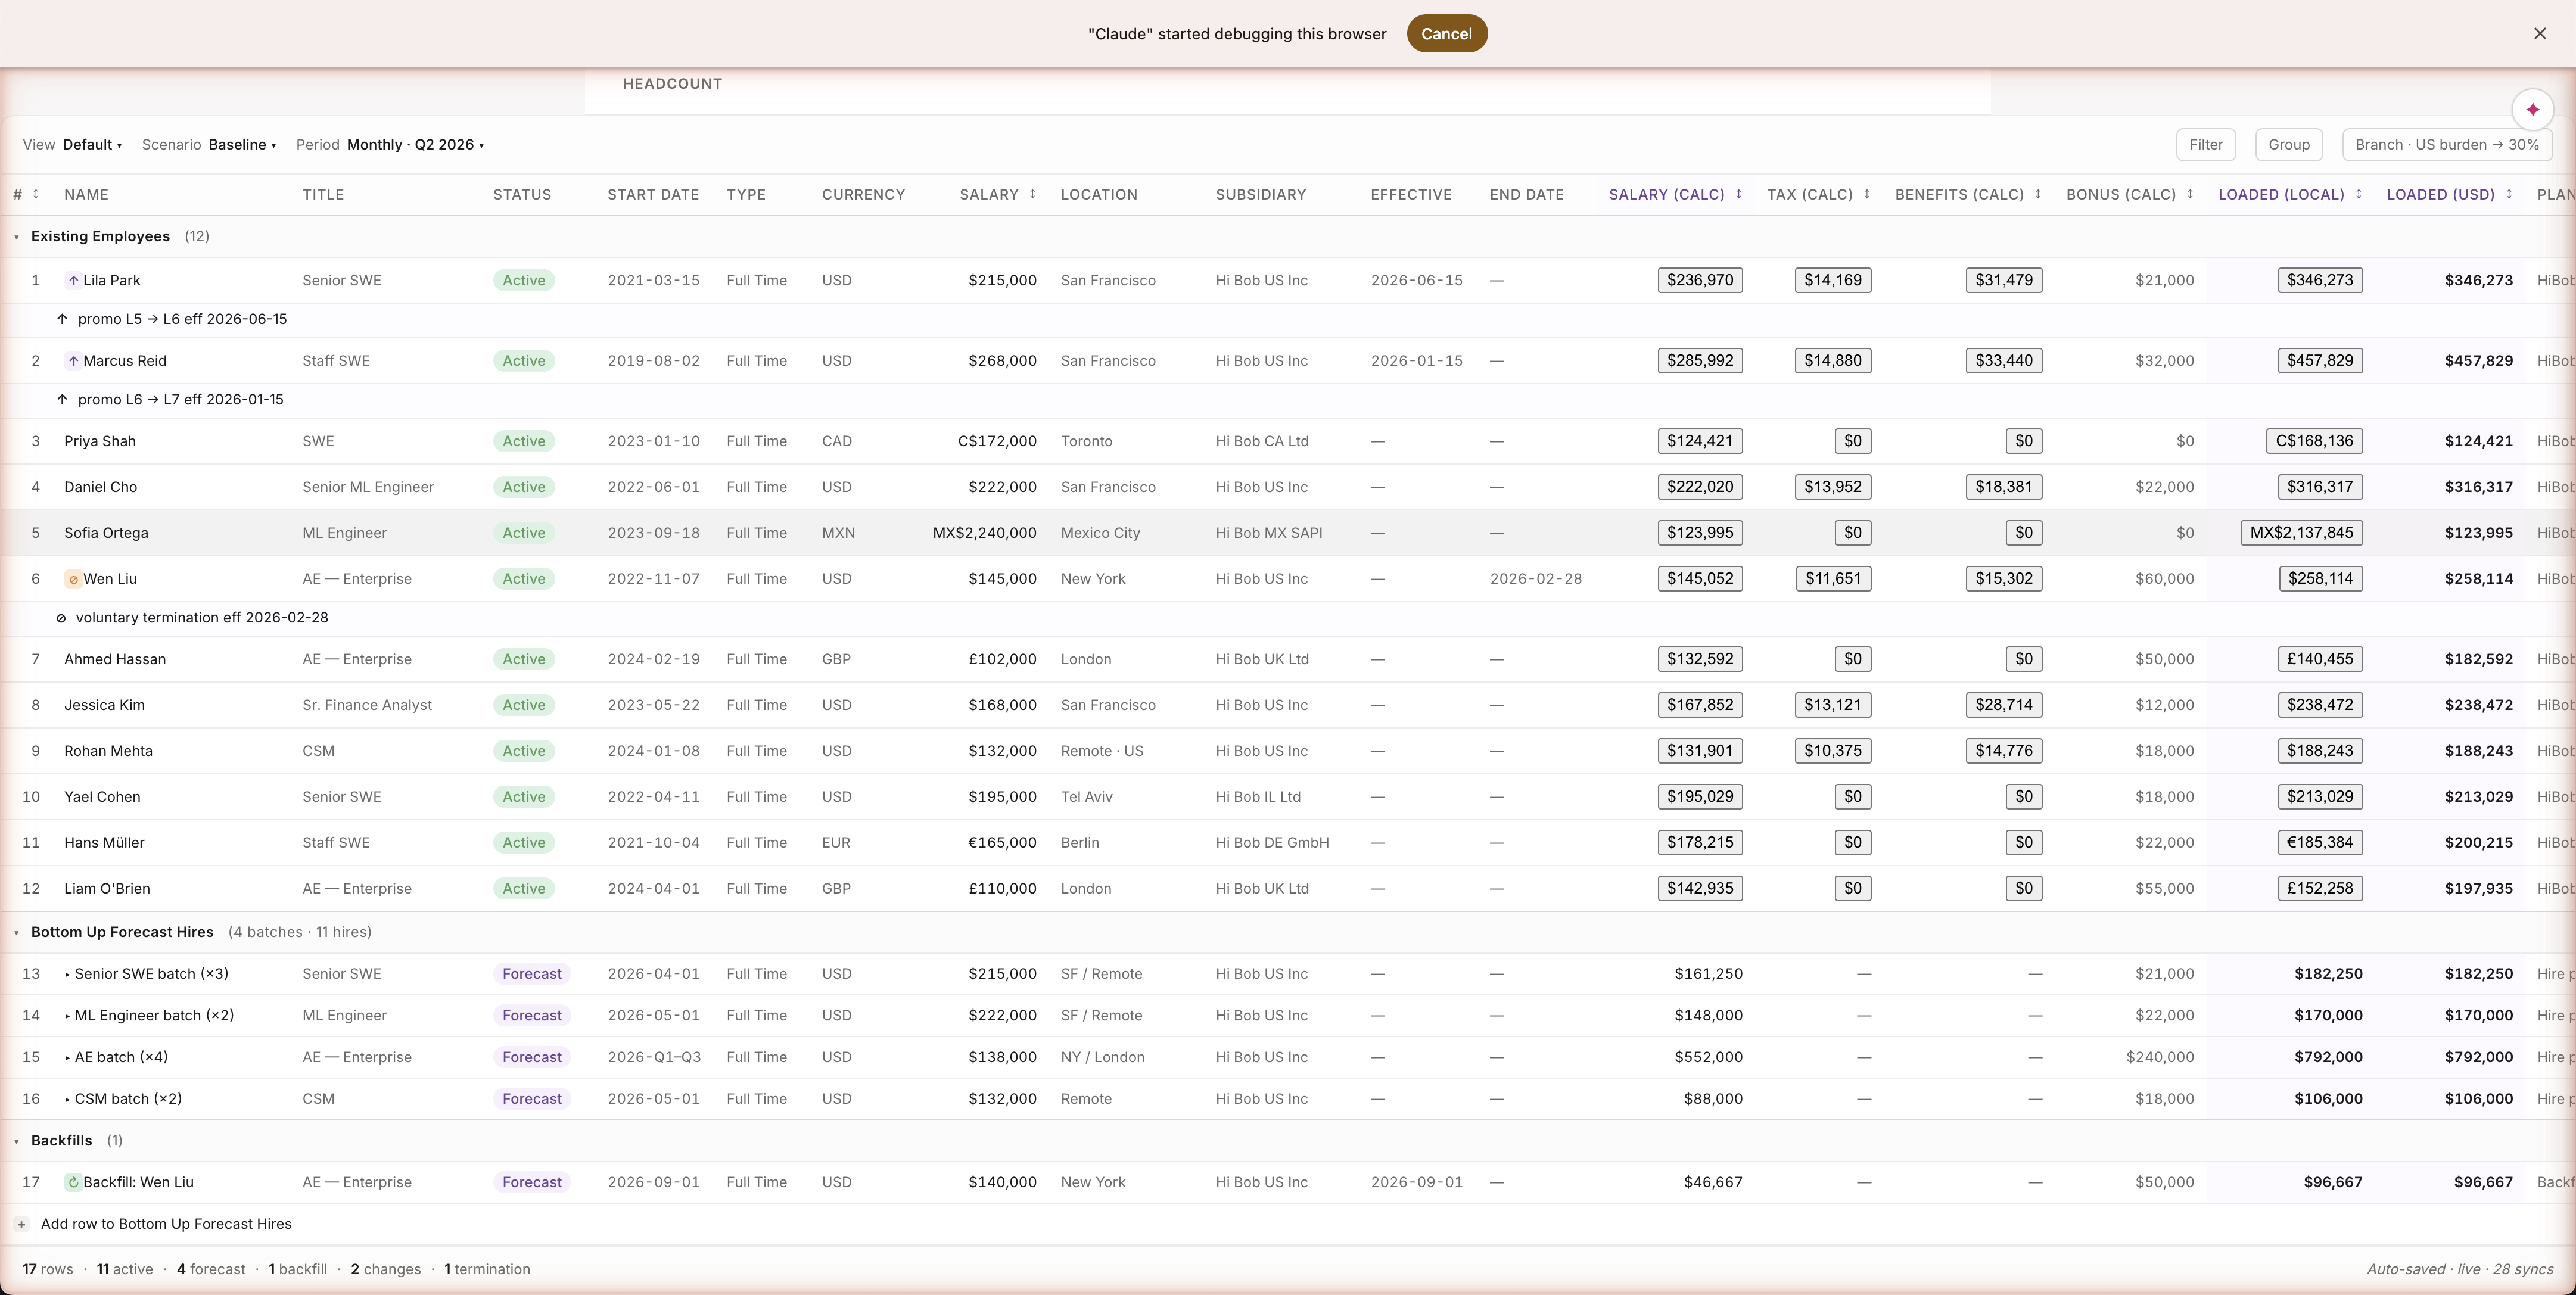
The sheet a finance person actually uses
Drilling in shows you a real planning sheet — 12 employees, salary in their local currency, tax and benefits computed per row, fully-loaded comp shown both locally and in USD. Lila Park (US): $346,211. Ahmed Hassan (UK): £140,455 → $182,592. Five currencies, real names from a real HRIS export, every cell computed by code — not estimated by the AI. What you'd open in Excel — without the formulas being a black box.
Path A · Build · Assumption anatomy
What an assumption looks like
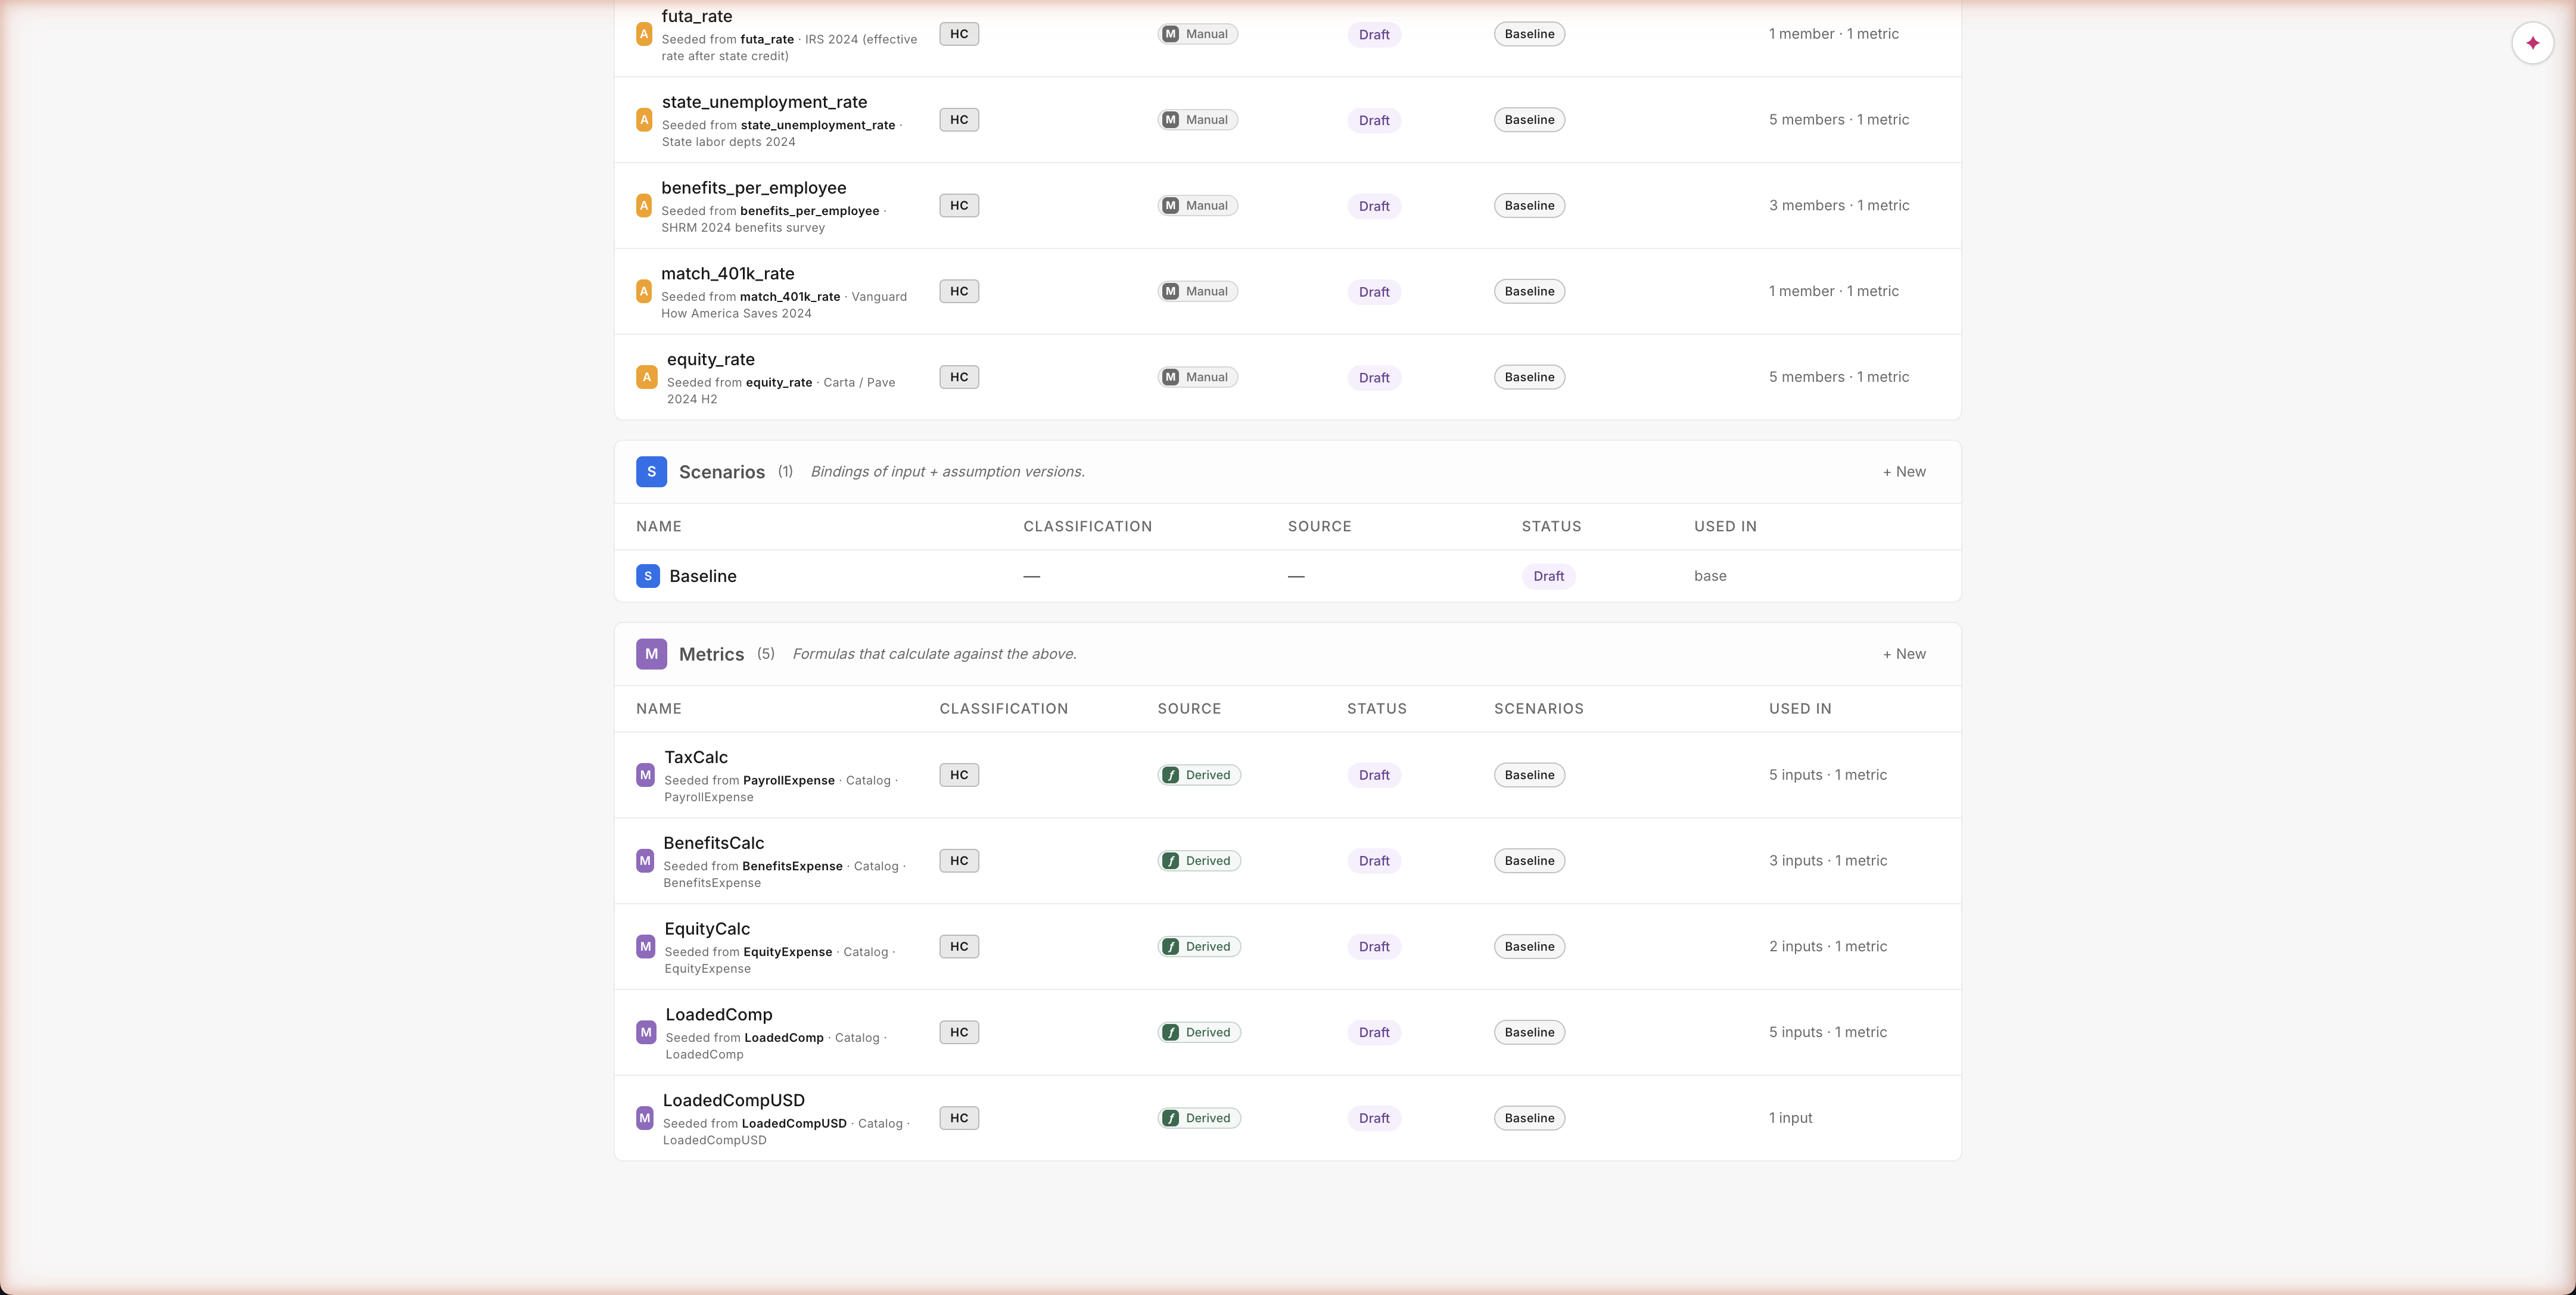
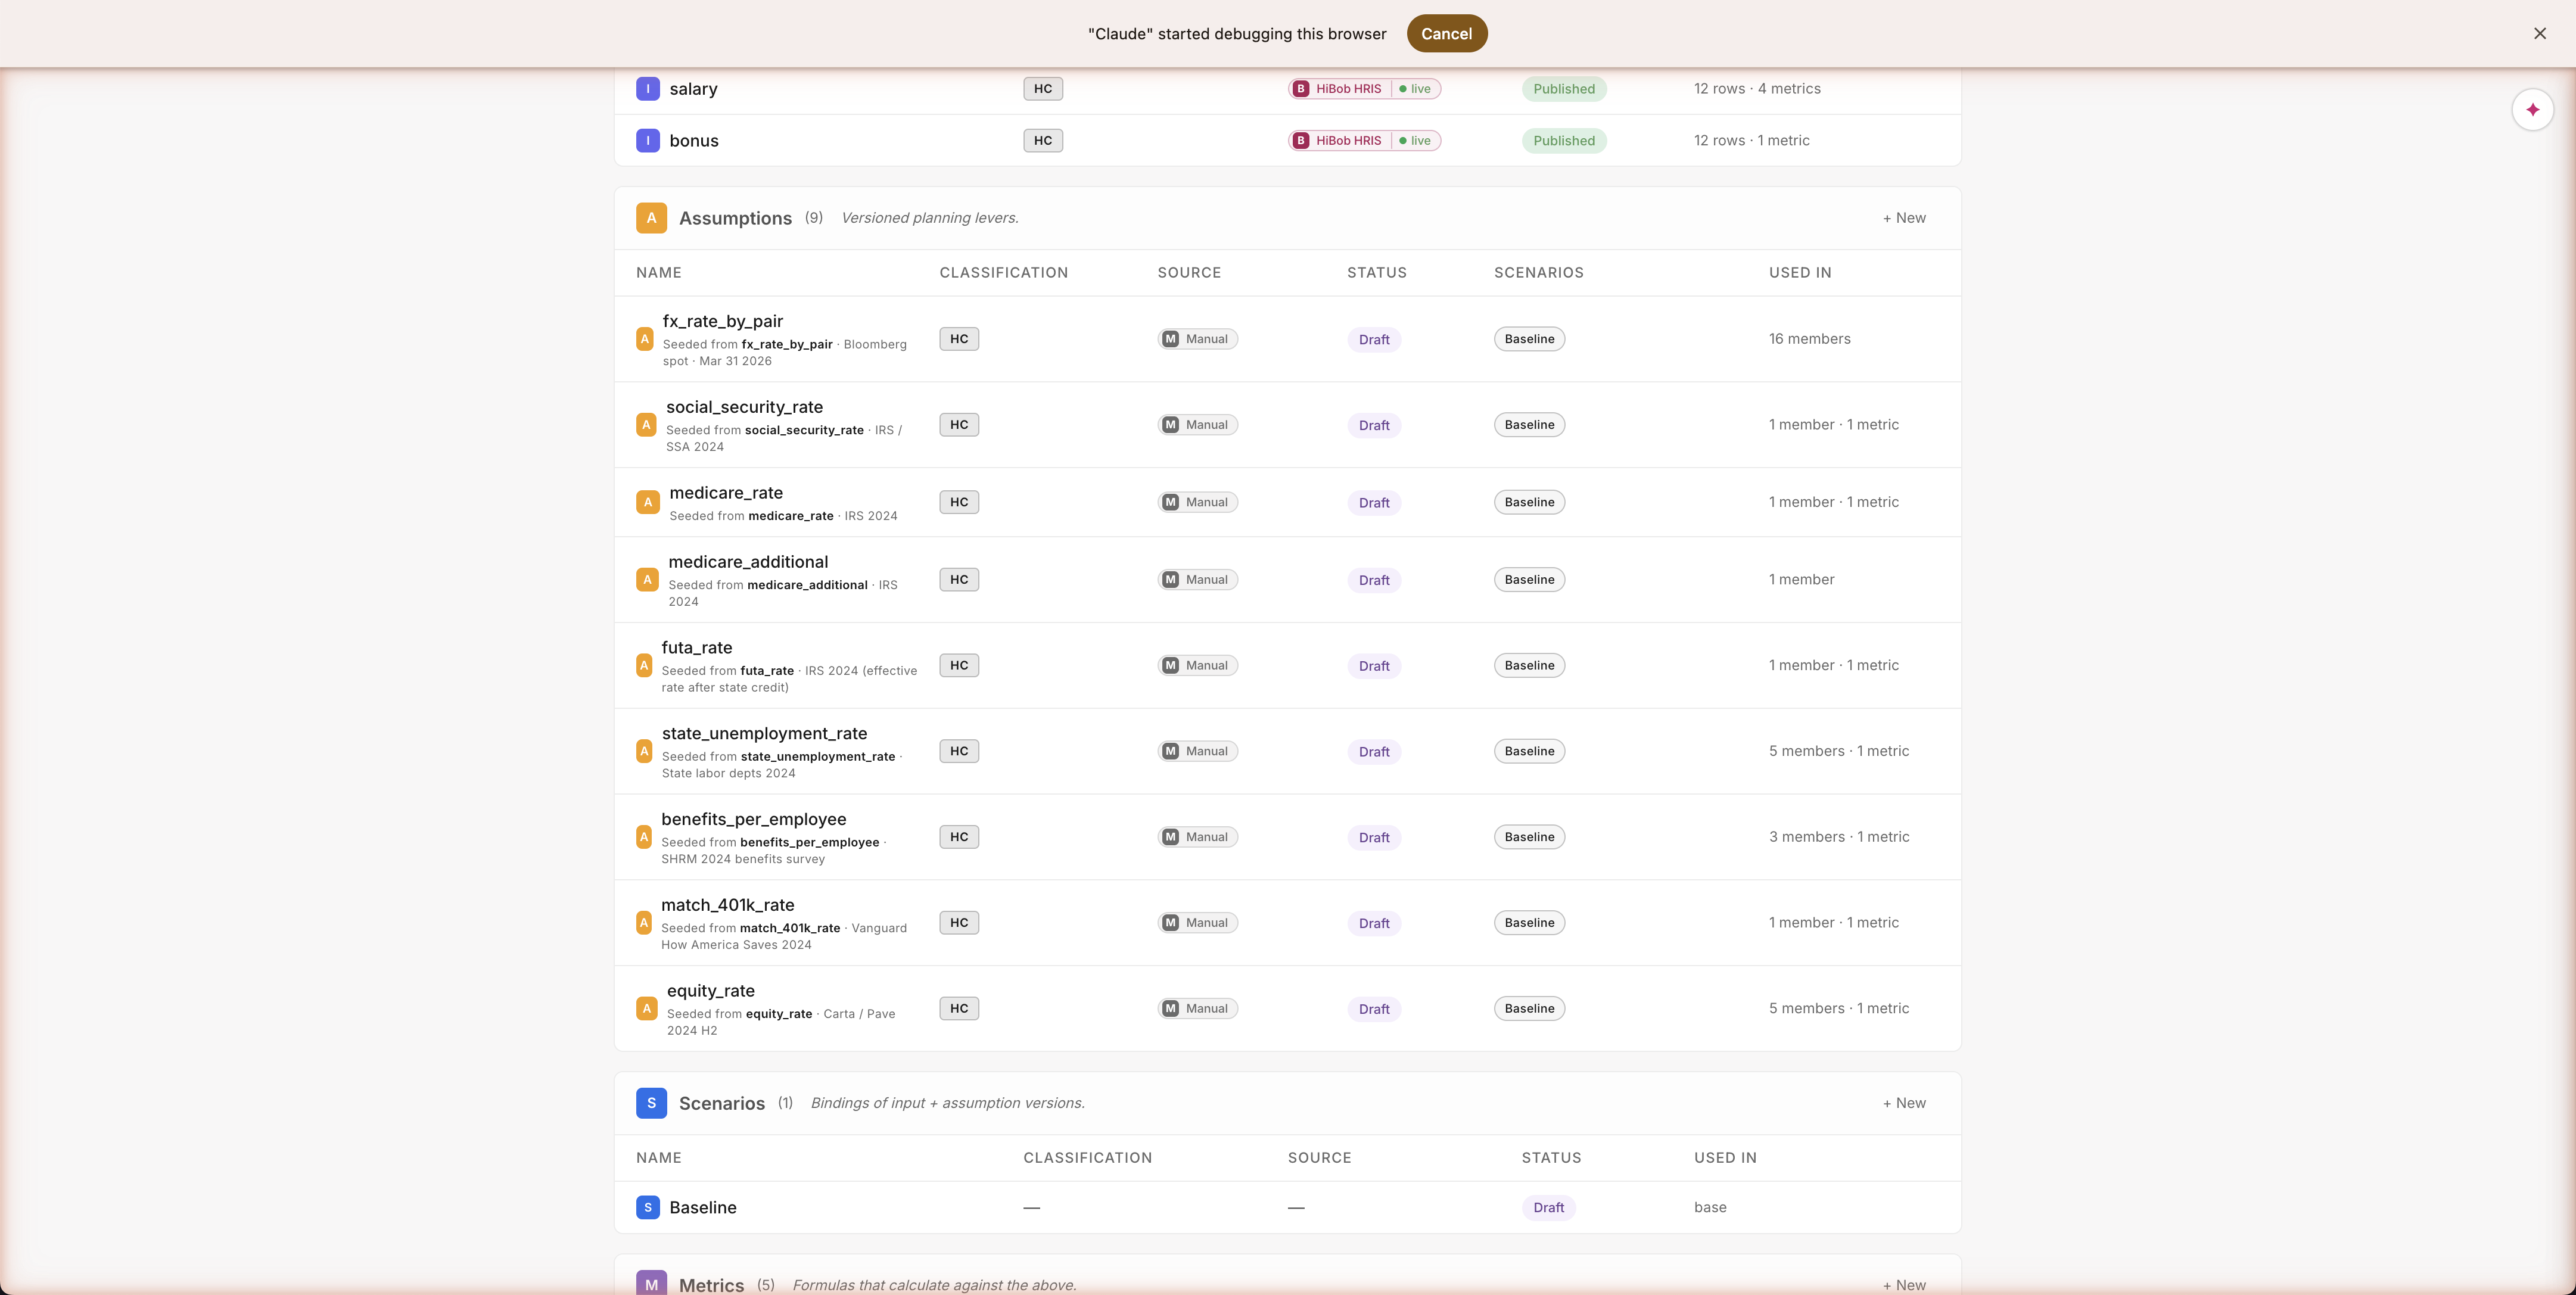
What an assumption looks like in the Library
Every row tells you five things at a glance: the name, where it came from (IRS, SHRM, Vanguard, Carta — all cited), which type of plan uses it, whether it was typed by hand or pulled from a connector, and how many other parts of the model depend on it. Same view for the user as for the agent — no hidden state, no "magic" the agent knows that you don't.
Path A · Build · Inspect any assumption
Click social_security_rate → see every value, every gap
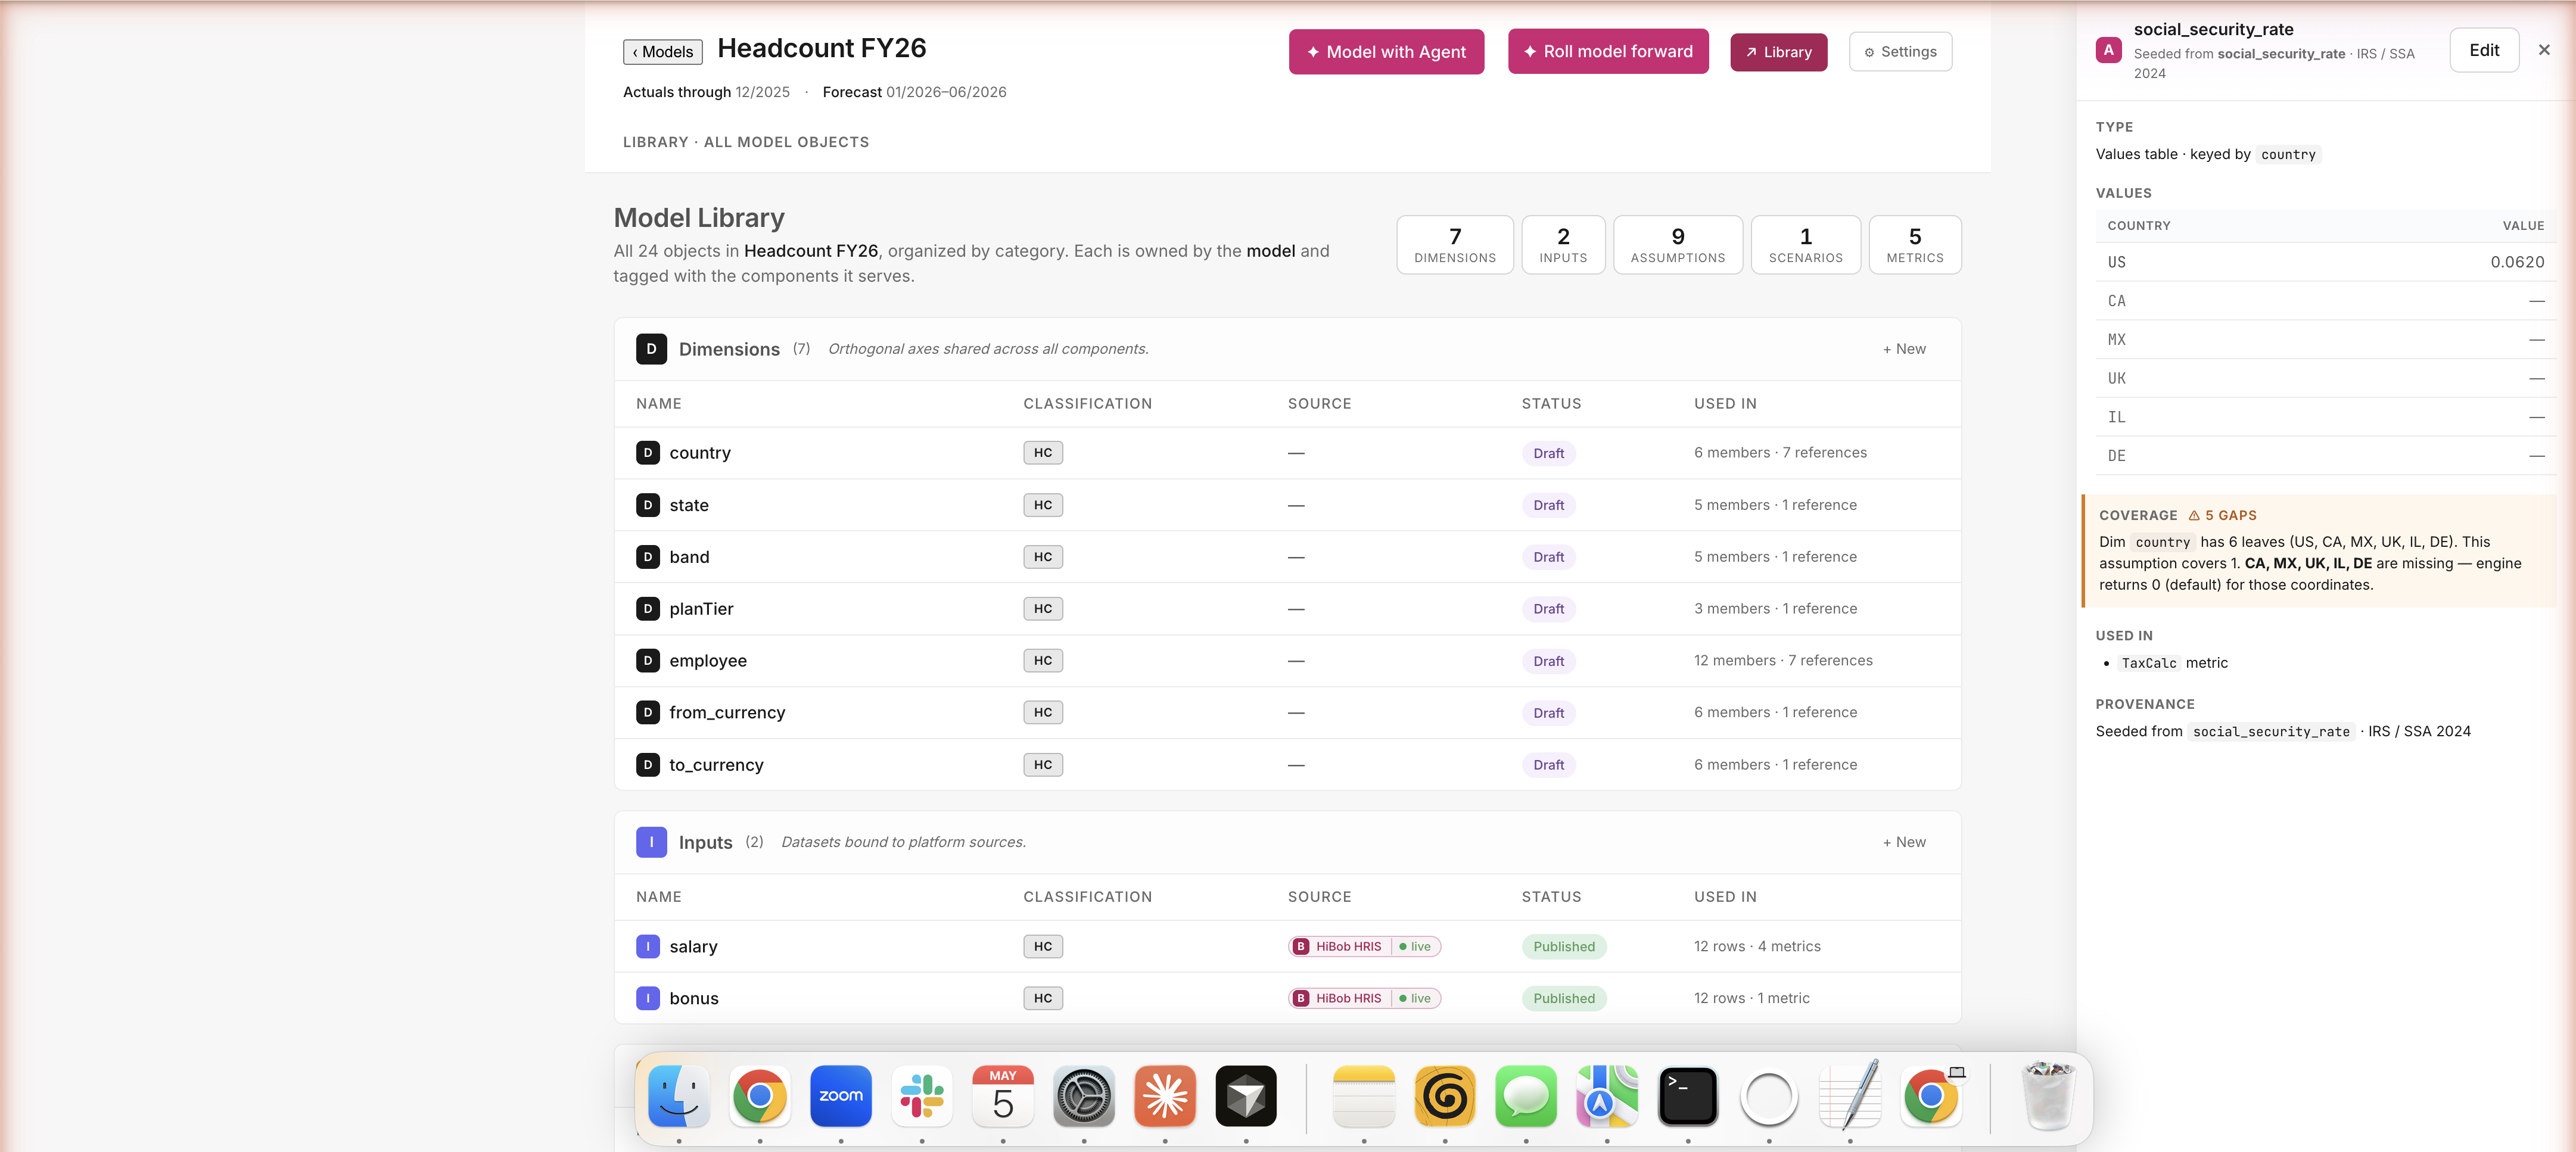
Click a row, see everything
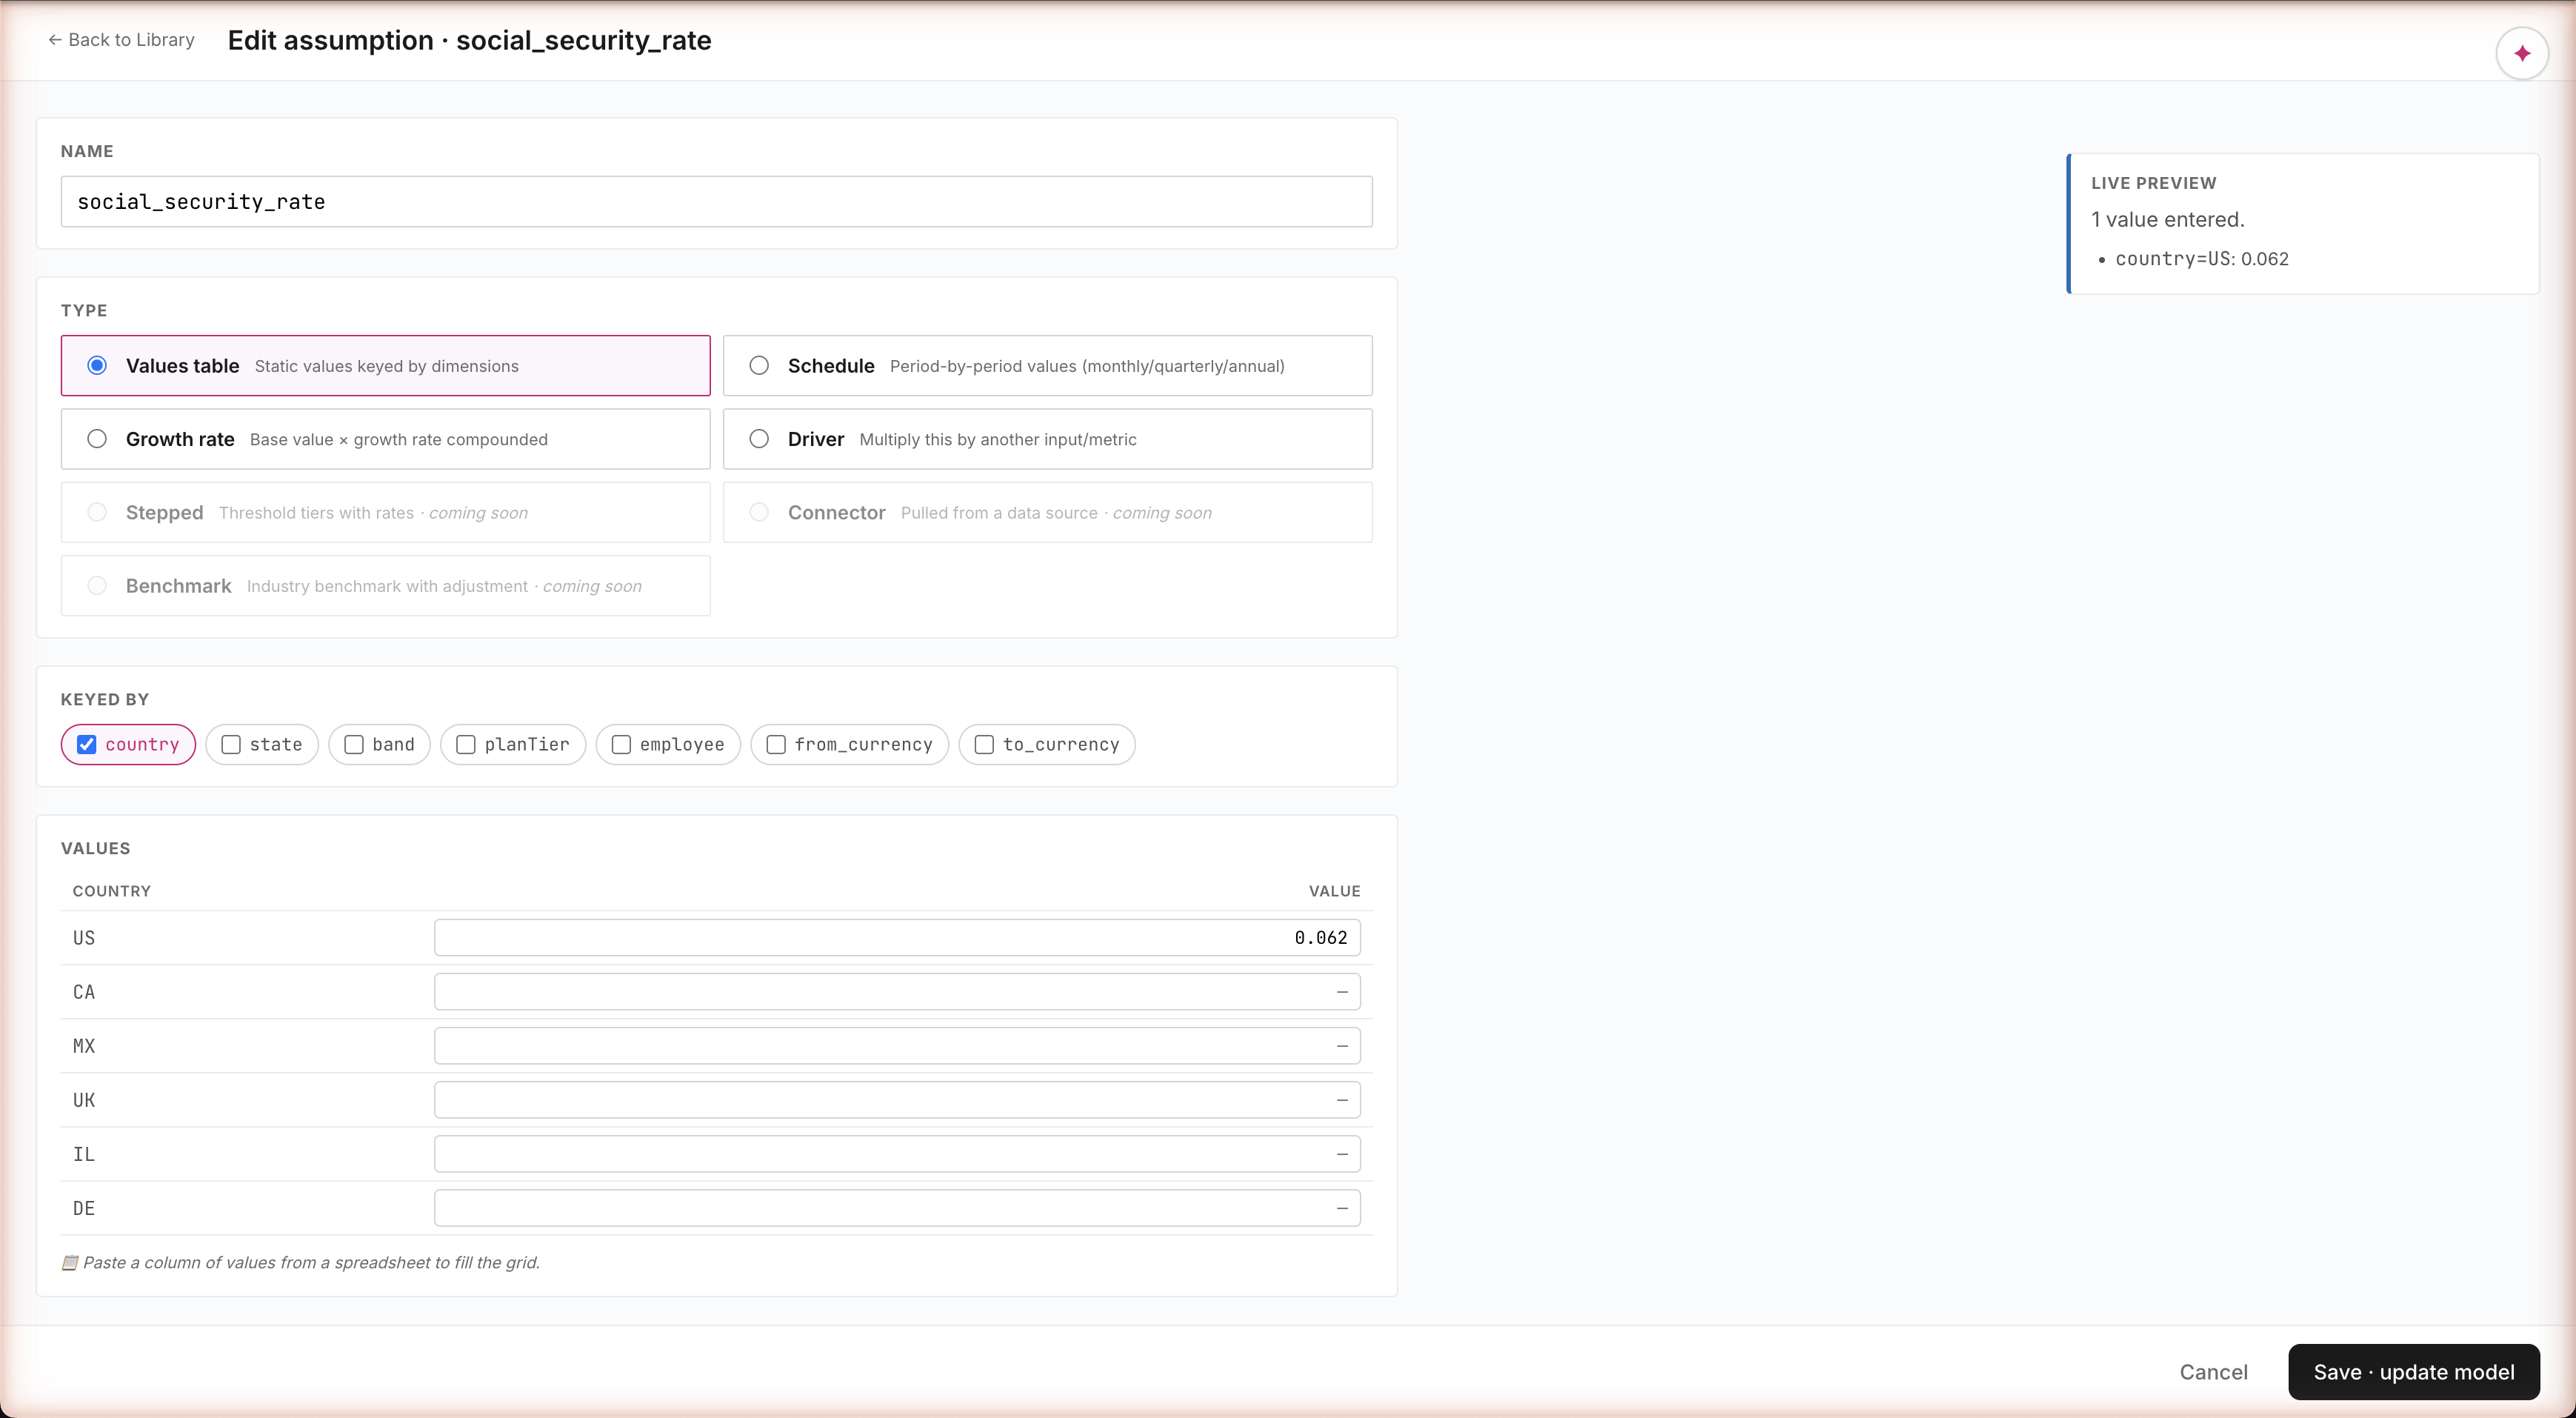
A side panel slides open with the actual values (US: 6.2%), a coverage check ("5 countries are missing — UK, CA, MX, IL, DE"), what depends on this (the Tax calc), and where the number came from (IRS / SSA 2024). One screen answers the question every CFO eventually asks: "wait, did this rate get applied to all countries or just the US?" No spelunking through code, no "let me ask the analyst" — just visible.
Path A · Build · Edit any assumption
Change US 0.062 → 0.07 · Save · model recomputes
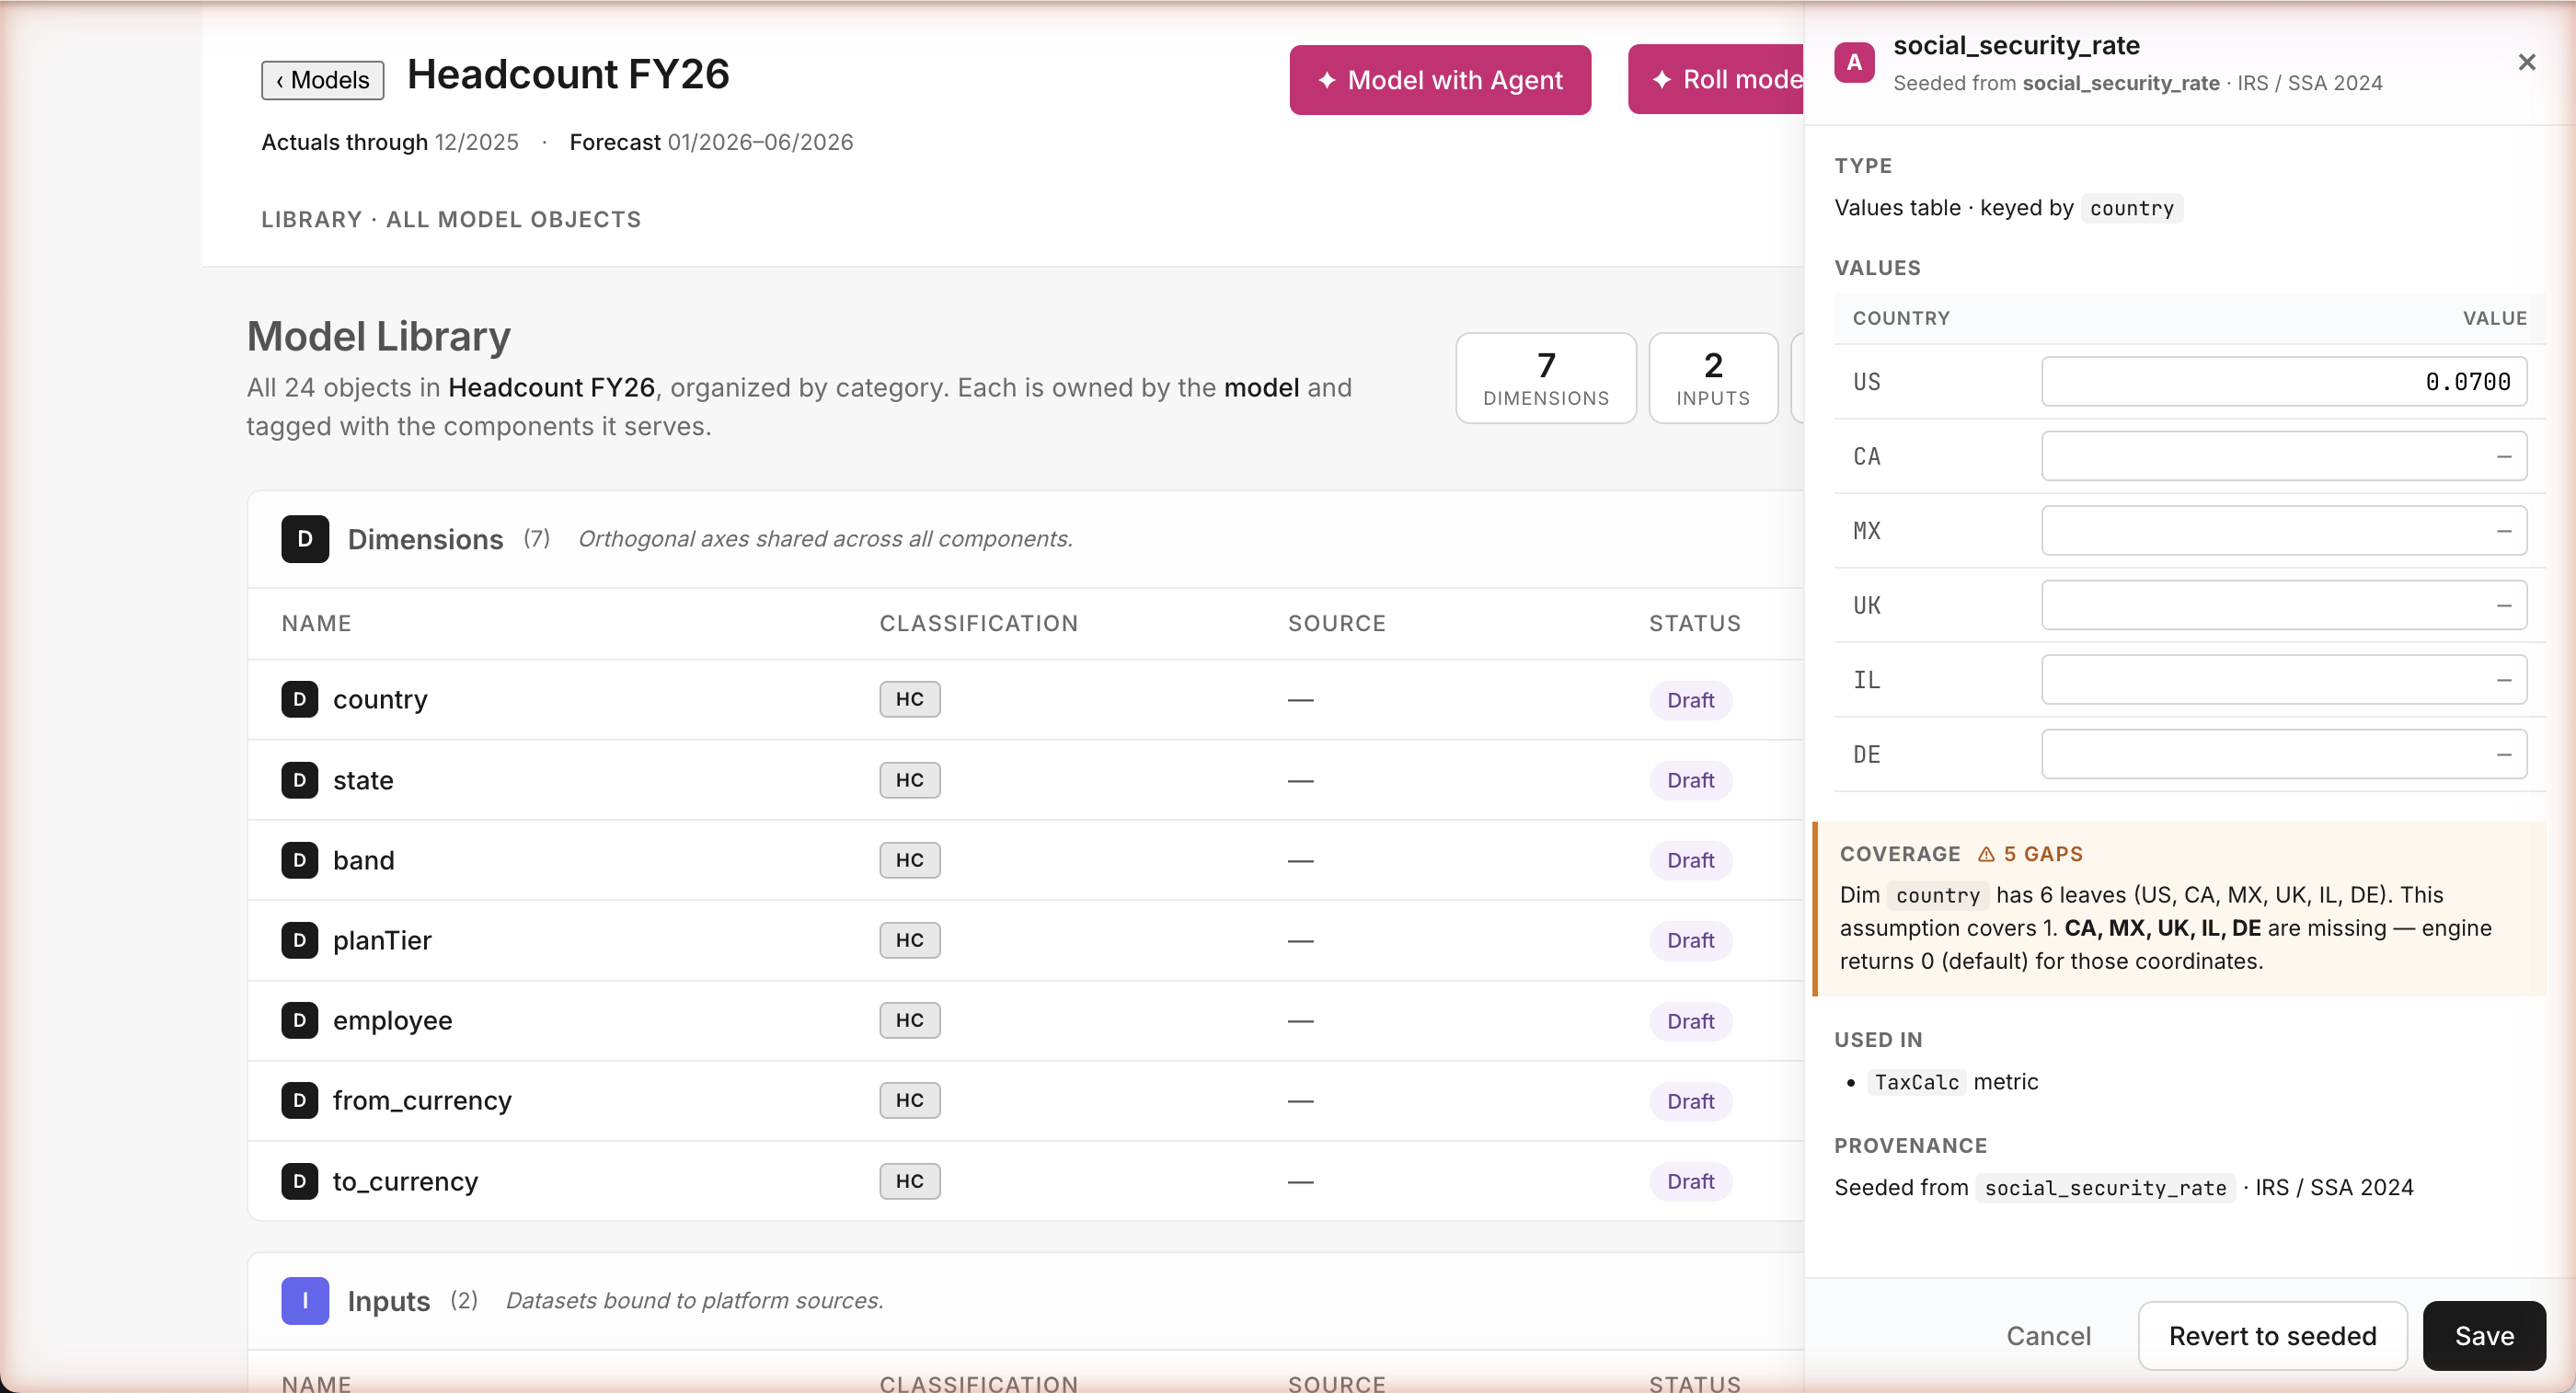
Edit it. Save. Watch the model update.
Whether the agent built this assumption or you did, you change it the same way: click the value, type a new one, hit Save. The model recomputes on the spot — every US employee's loaded comp shifts to reflect the new tax rate. Or hit Revert to seeded to restore the IRS default. The agent and the human are equal authors here.
Path A · Build · Where the calc lives
Where LoadedComp is generated
src/agent/catalogs/metrics.tscatalog formula · authoritative
LoadedComp: {
id: 'LoadedComp',
formula: `salary
+ bracketed(salary, social_security_rate@employee.country)
+ salary * medicare_rate@employee.country
+ bracketed(salary, futa_rate@employee.country)
+ bracketed(salary, state_unemployment_rate@employee.state)
+ benefits_per_employee@employee.country,planTier
+ salary * match_401k_rate
+ salary * equity_rate@band
+ bonus`,
dimKeys: ['employee', 'period'],
classification: ['HC', 'IS'],
dependsOn: { // 8 assumptions, 1 input }
}
The Library row says "Seeded from LoadedComp · Catalog · LoadedComp" — i.e. the metric in this model is a reference to the catalog definition. bracketed() applies the wage cap (e.g. SSA wage base $168,600 for 2024); @employee.country picks the per-country rate. The runtime expression in the model is the simpler salary + TaxCalc + BenefitsCalc + EquityCalc + bonus, where each *Calc is itself a derived metric in the same Library — composable lookups, not free-form formulas.
Where the math actually lives
Every metric is defined in a single source file — a catalog of standard FP&A formulas. LoadedComp = salary plus tax burden plus benefits plus equity plus bonus, with country-specific rates and IRS wage caps applied. The agent doesn't invent this formula on the fly — it picks the formula from the catalog. No hidden math, no hallucinated calculations, every number traceable to a line of code.
Path A · Build · Inspect any metric
Click LoadedComp → formula, dependency tree, per-employee values
Click a metric → see what feeds into it
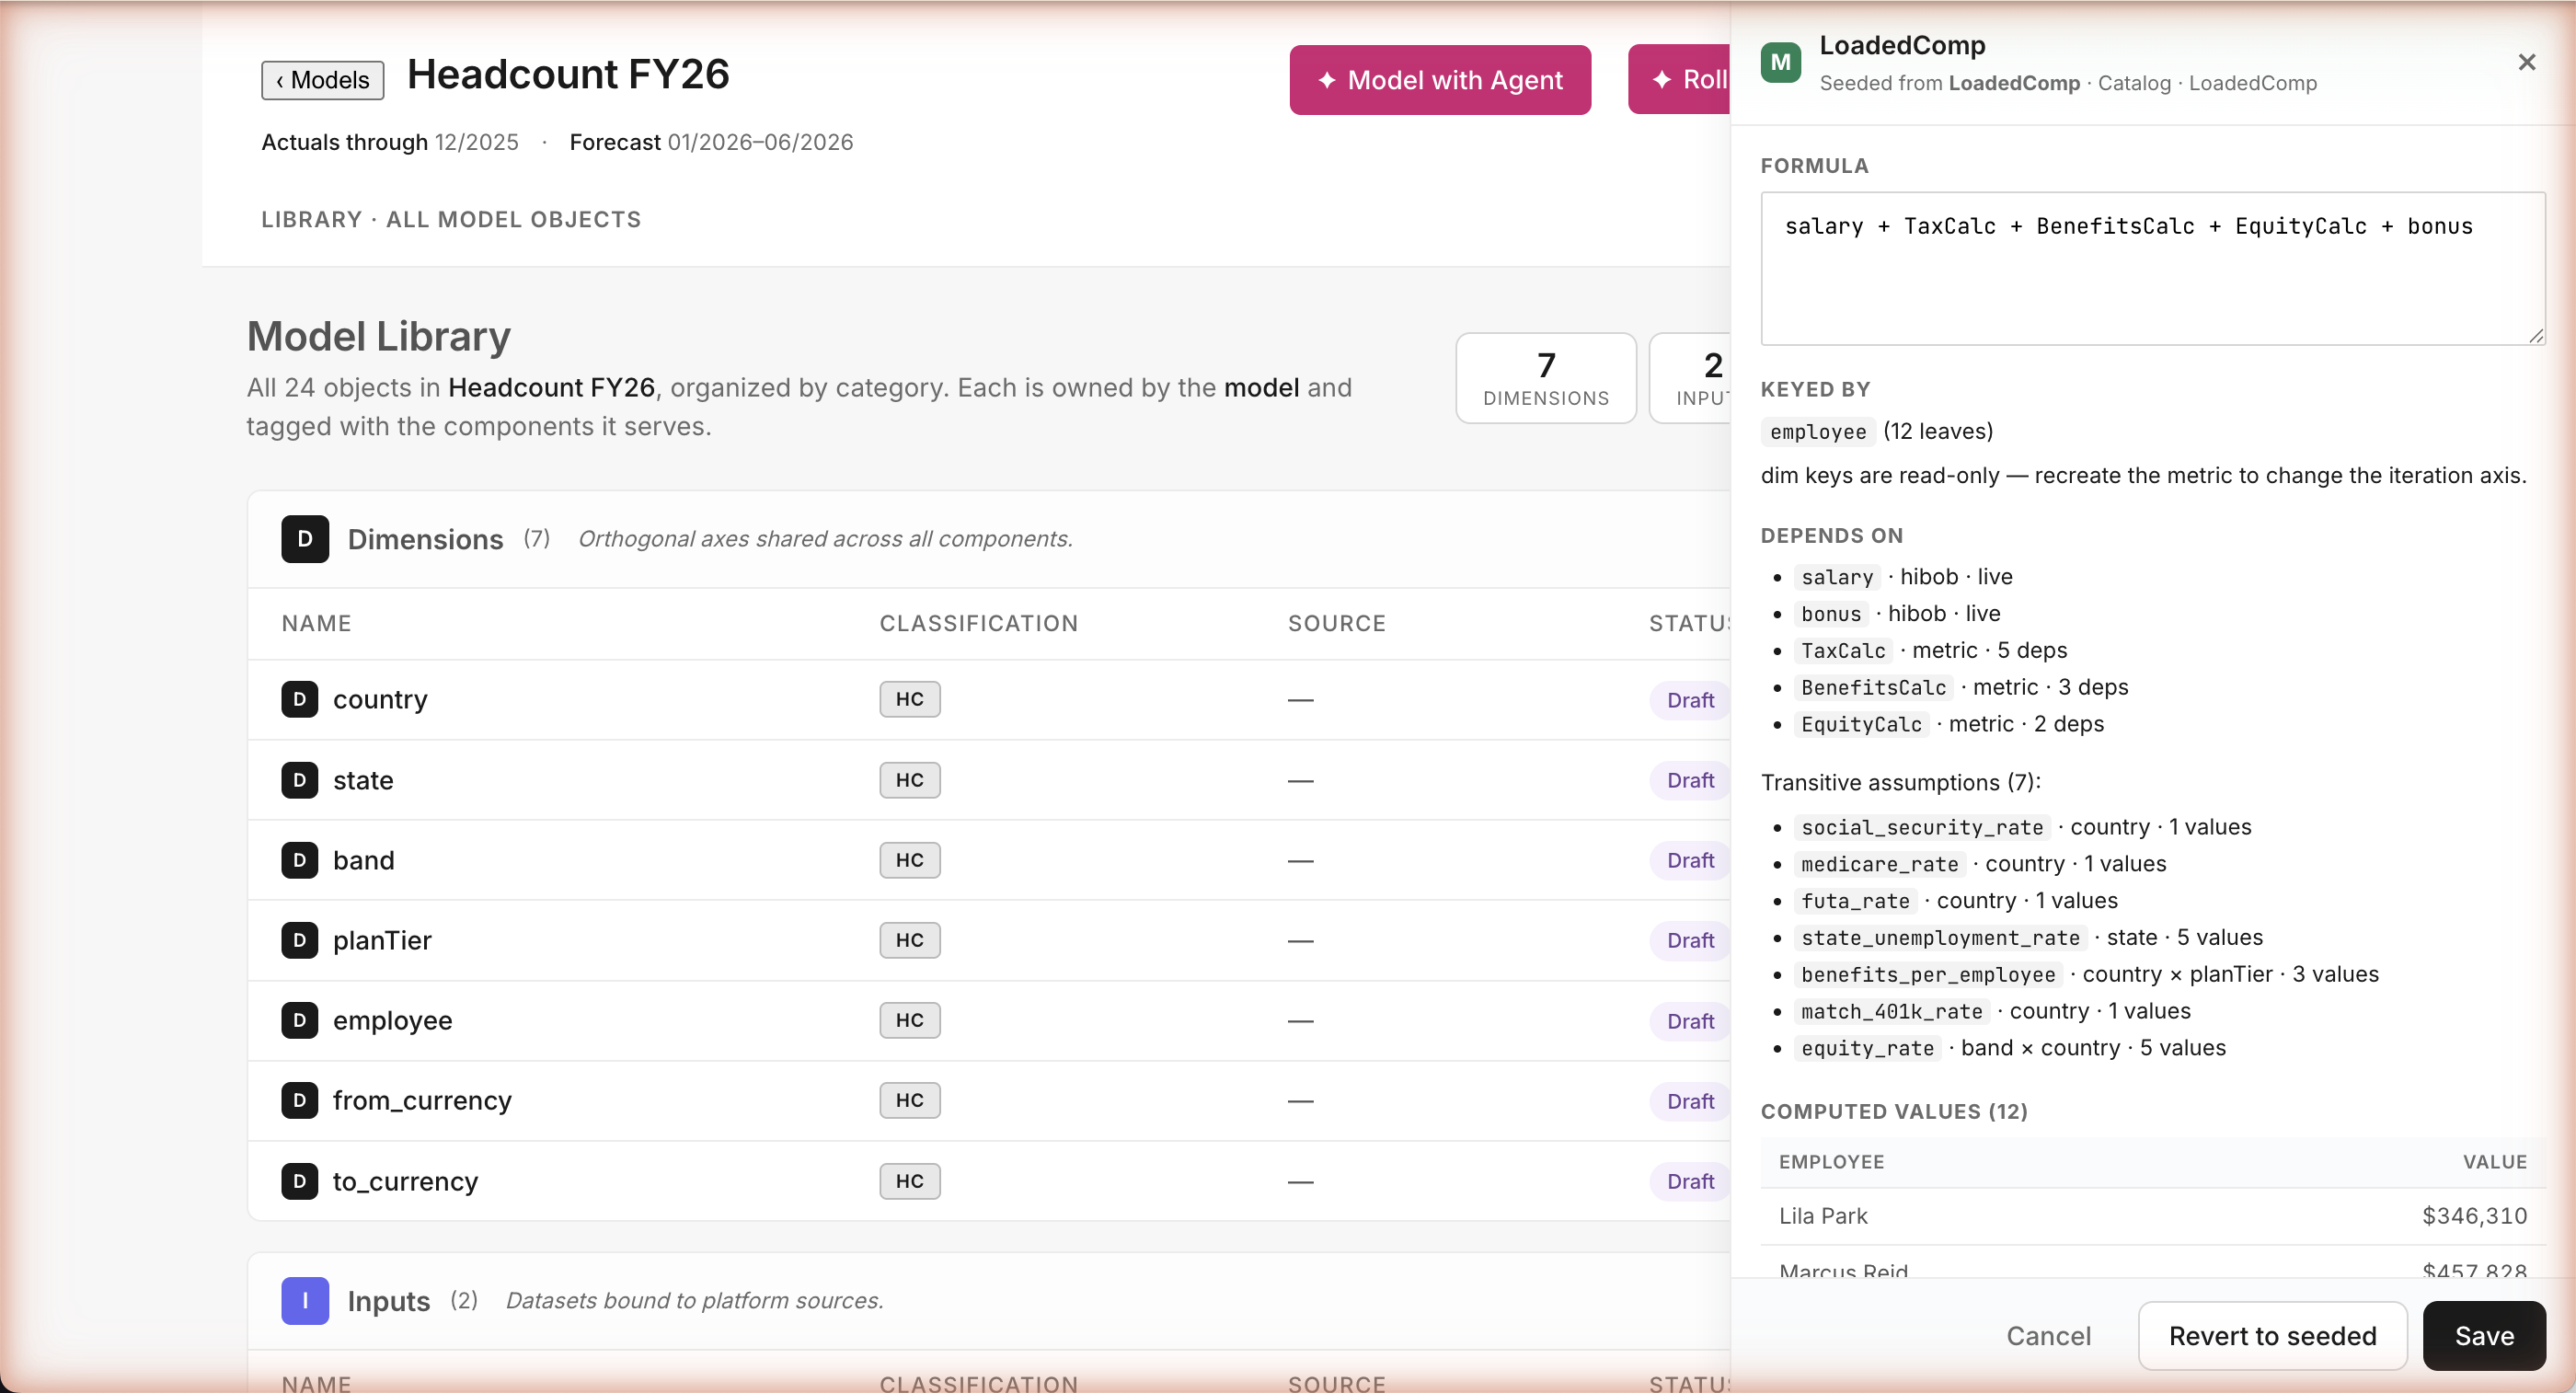
The formula. The inputs (salary and bonus from HiBob). The metrics it depends on (Tax, Benefits, Equity). The seven underlying assumptions (each with their own coverage check). Plus per-employee output values right there in the drawer — Lila's $346K, Marcus's $458K, all the way down. Open any object, see everything that contributes to it. No black boxes.
Path A · Build · Edit any metric
Tweak the LoadedComp formula · Save · everything recomputes
Tweak a formula. Watch everything update.
"Add a 5% bonus uplift to Loaded Comp." Type it, save it — every employee's number recomputes immediately. Bad formula? The system catches circular references before you save and tells you exactly what's wrong. Revert restores the original. Same loop the agent uses internally — except you're driving.
Path A · Build · Author manually
Add a new assumption — agent and human, same surface
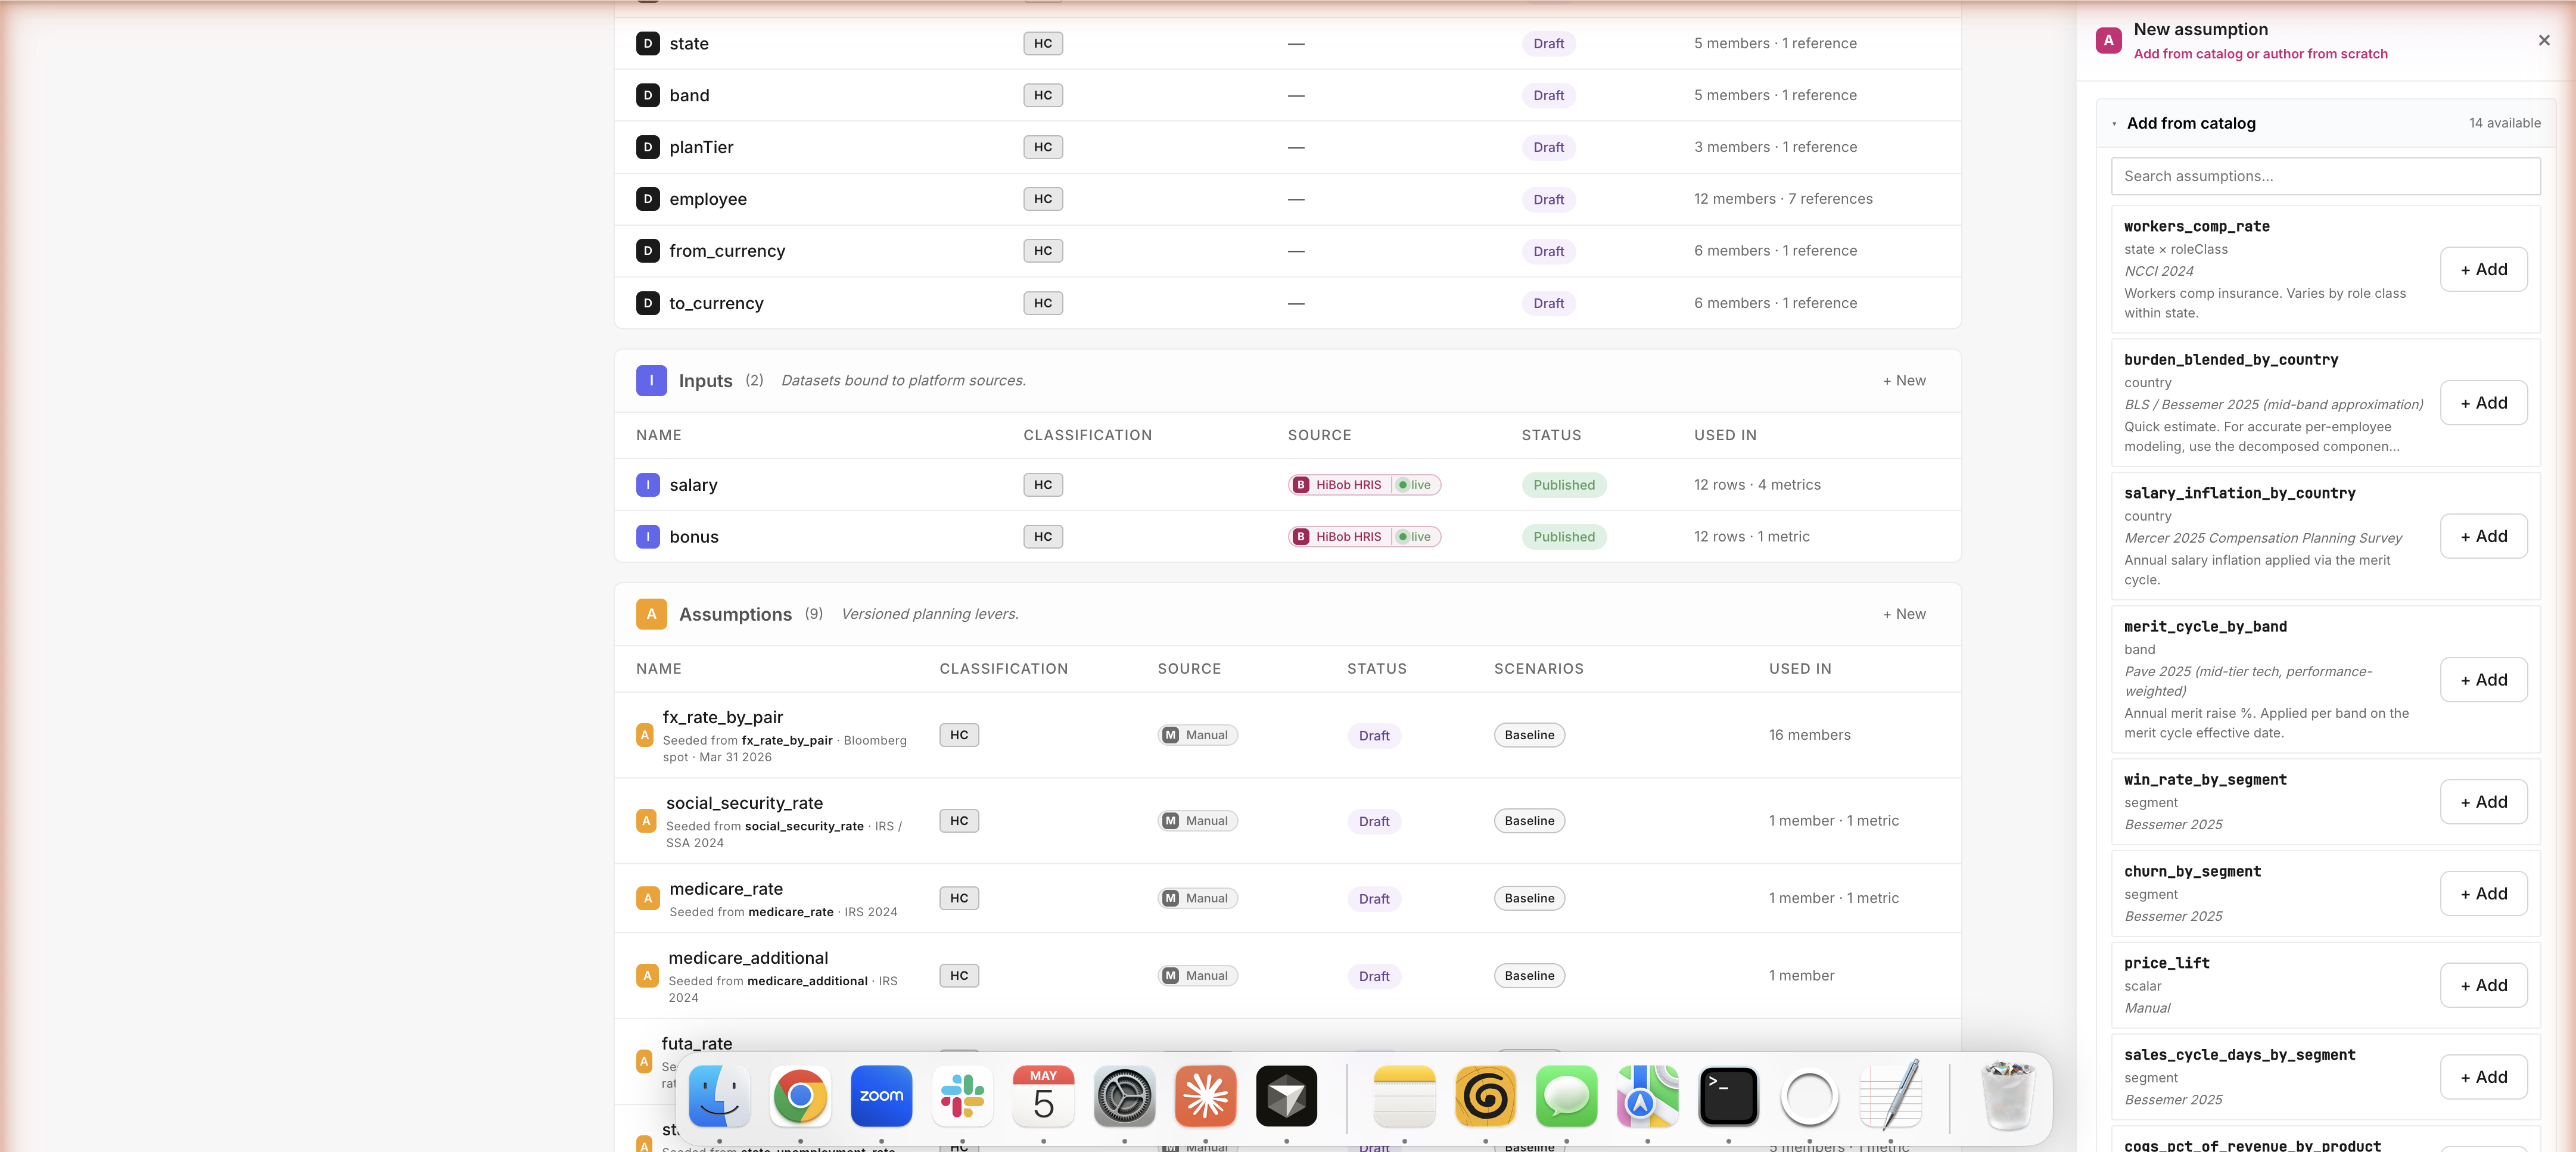
Add an assumption — agent or human, same surface
Need a new assumption in your model? Click + Add and pick from the catalog (workers comp, equity refresh, win rates by segment — 14 options ready to go with benchmark sources baked in). Or author from scratch — name it, pick dimensions, paste your values from Excel. Whatever you click, you produce the same thing the agent produces when it builds. The agent and the FP&A user are equal first-class authors.
Path A · Build · Author Surface · Values type
Full-page builder · 7 assumption types · type-aware authoring
A real builder for real FP&A modeling
Side drawer is great for quick edits. For substantial work, click Open builder → for a full-page authoring surface. Seven assumption types cover the FP&A modeling vocabulary: not just static rates, but schedules (hire plans), growth rates (salary inflation), drivers (revenue × win rate), and more. The agent picks the right type when it builds an assumption; you can swap types if it picked wrong.
Path A · Build · Author Surface · Schedule type
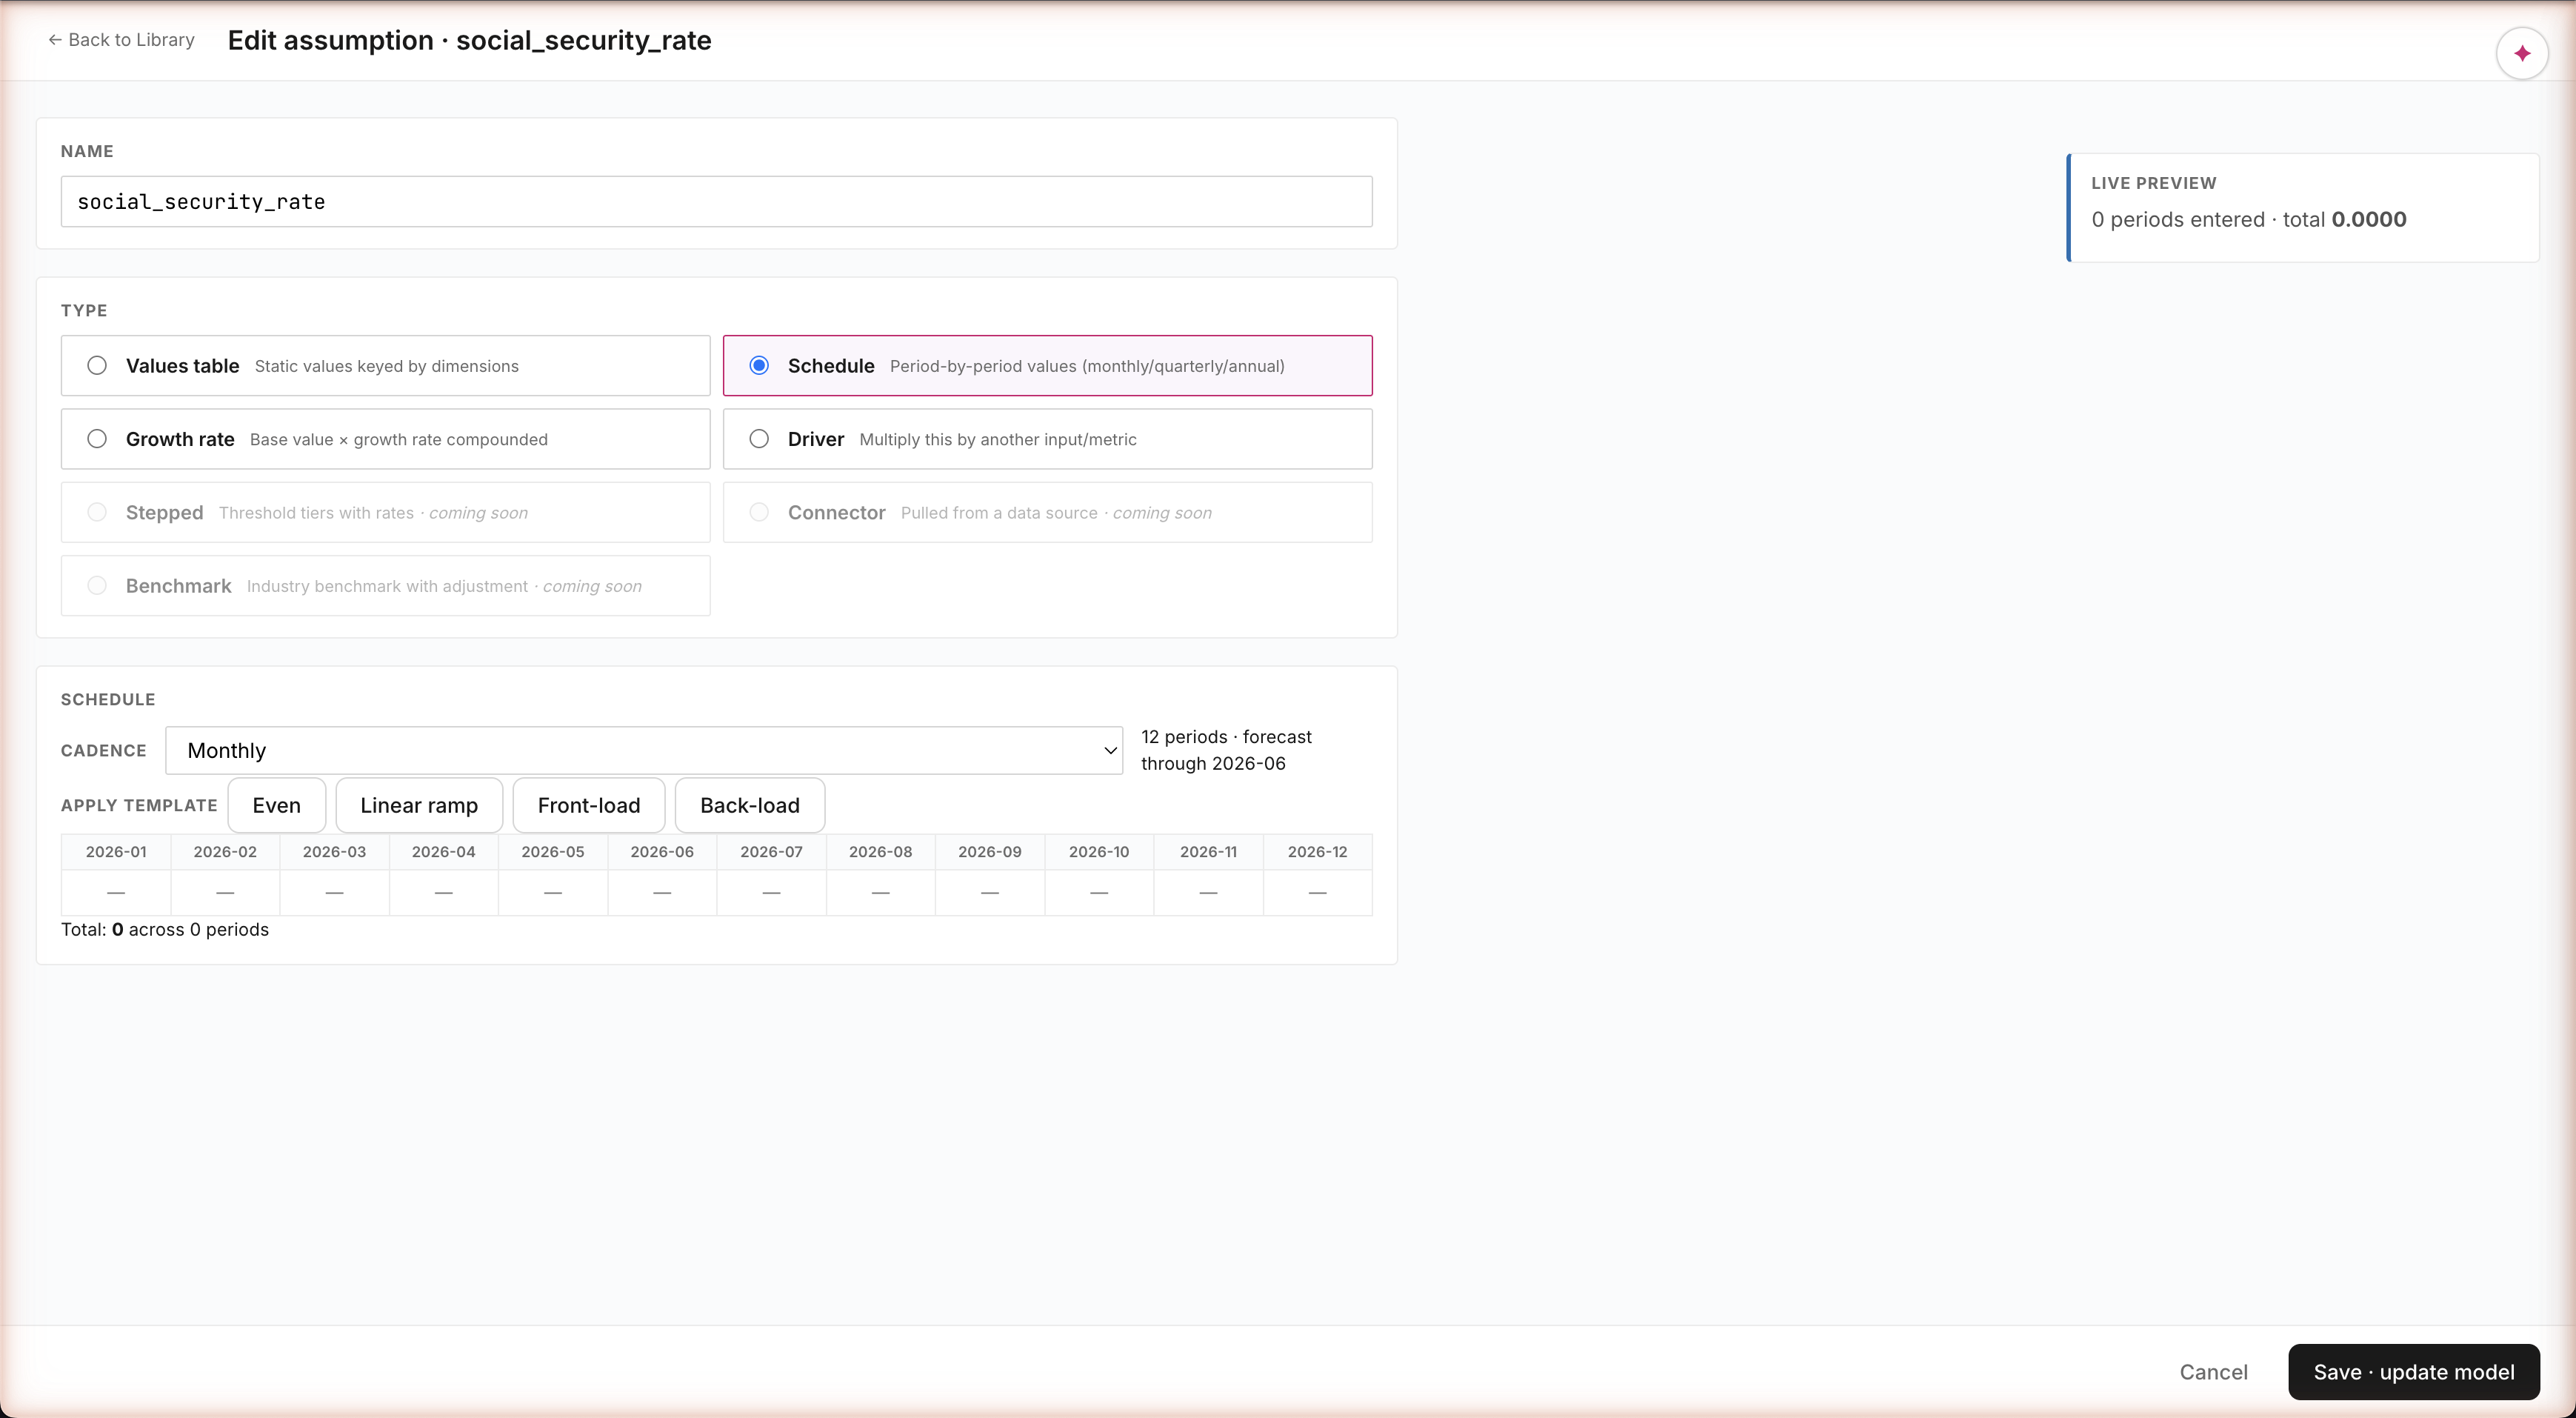
Schedule type — period-by-period values · paste-from-Excel · 4 templates
Period-by-period values — the FP&A workhorse
Things like a hire plan ("12 hires across 2026"), a capex schedule ("$500K Mar, $1M Jun, $300K Sep"), or a revenue ramp can't be modeled as a single number. Schedule type gives you a monthly grid with four shape templates — Even, Linear Ramp, Front-load, Back-load — that auto-fill the values. Paste from Excel works. Running total at the bottom. This is the modeling shape every FP&A team uses; we made it a first-class type.
Path A · Build · Author Surface · Growth type
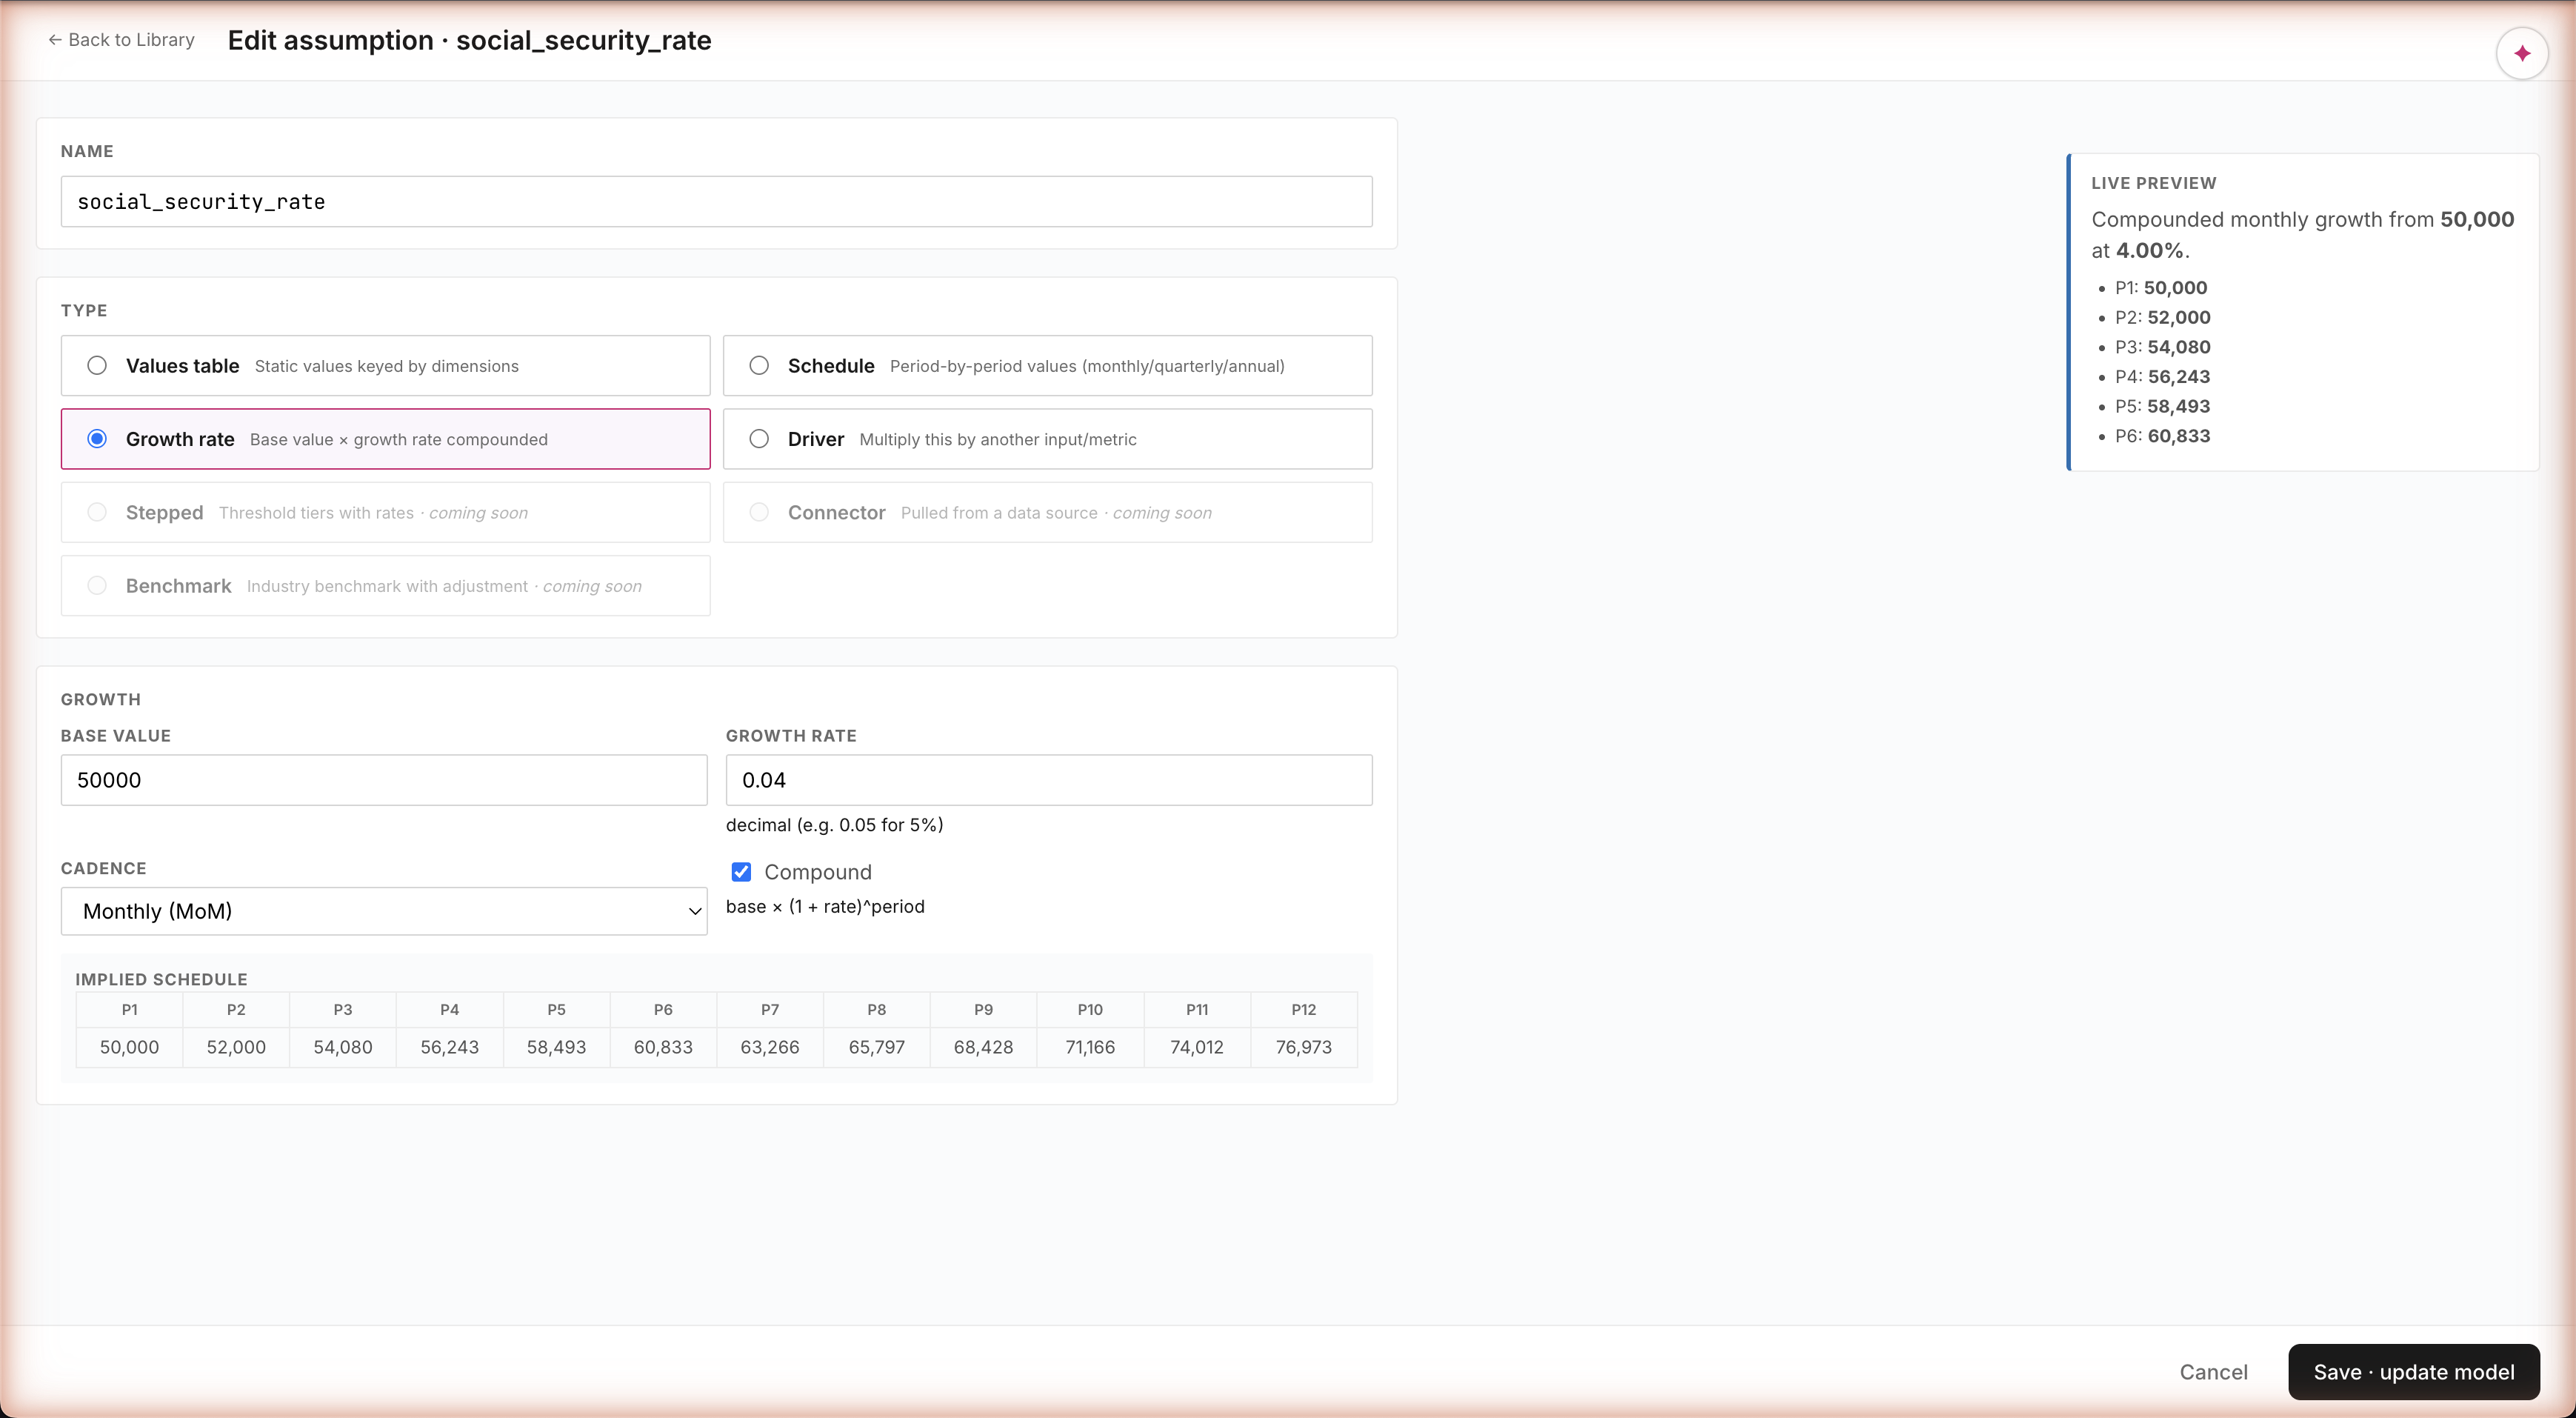
Growth rate — 50,000 × 4% MoM compounded → 76,973 by P12
Growth rate · auto-expanded forward projection
Things like "salary inflation 4% per year" or "ARR growth 5% per month" — type the base, the rate, pick monthly/quarterly/annual, and the surface auto-expands the full forward projection as you type. 50,000 at 4% MoM compounded → 76,973 by month 12. See exactly what your assumption will produce before you commit. Plus a guardrail that warns you if the rate looks suspiciously high.
Path A · Build · Author Surface · MetricAuthor
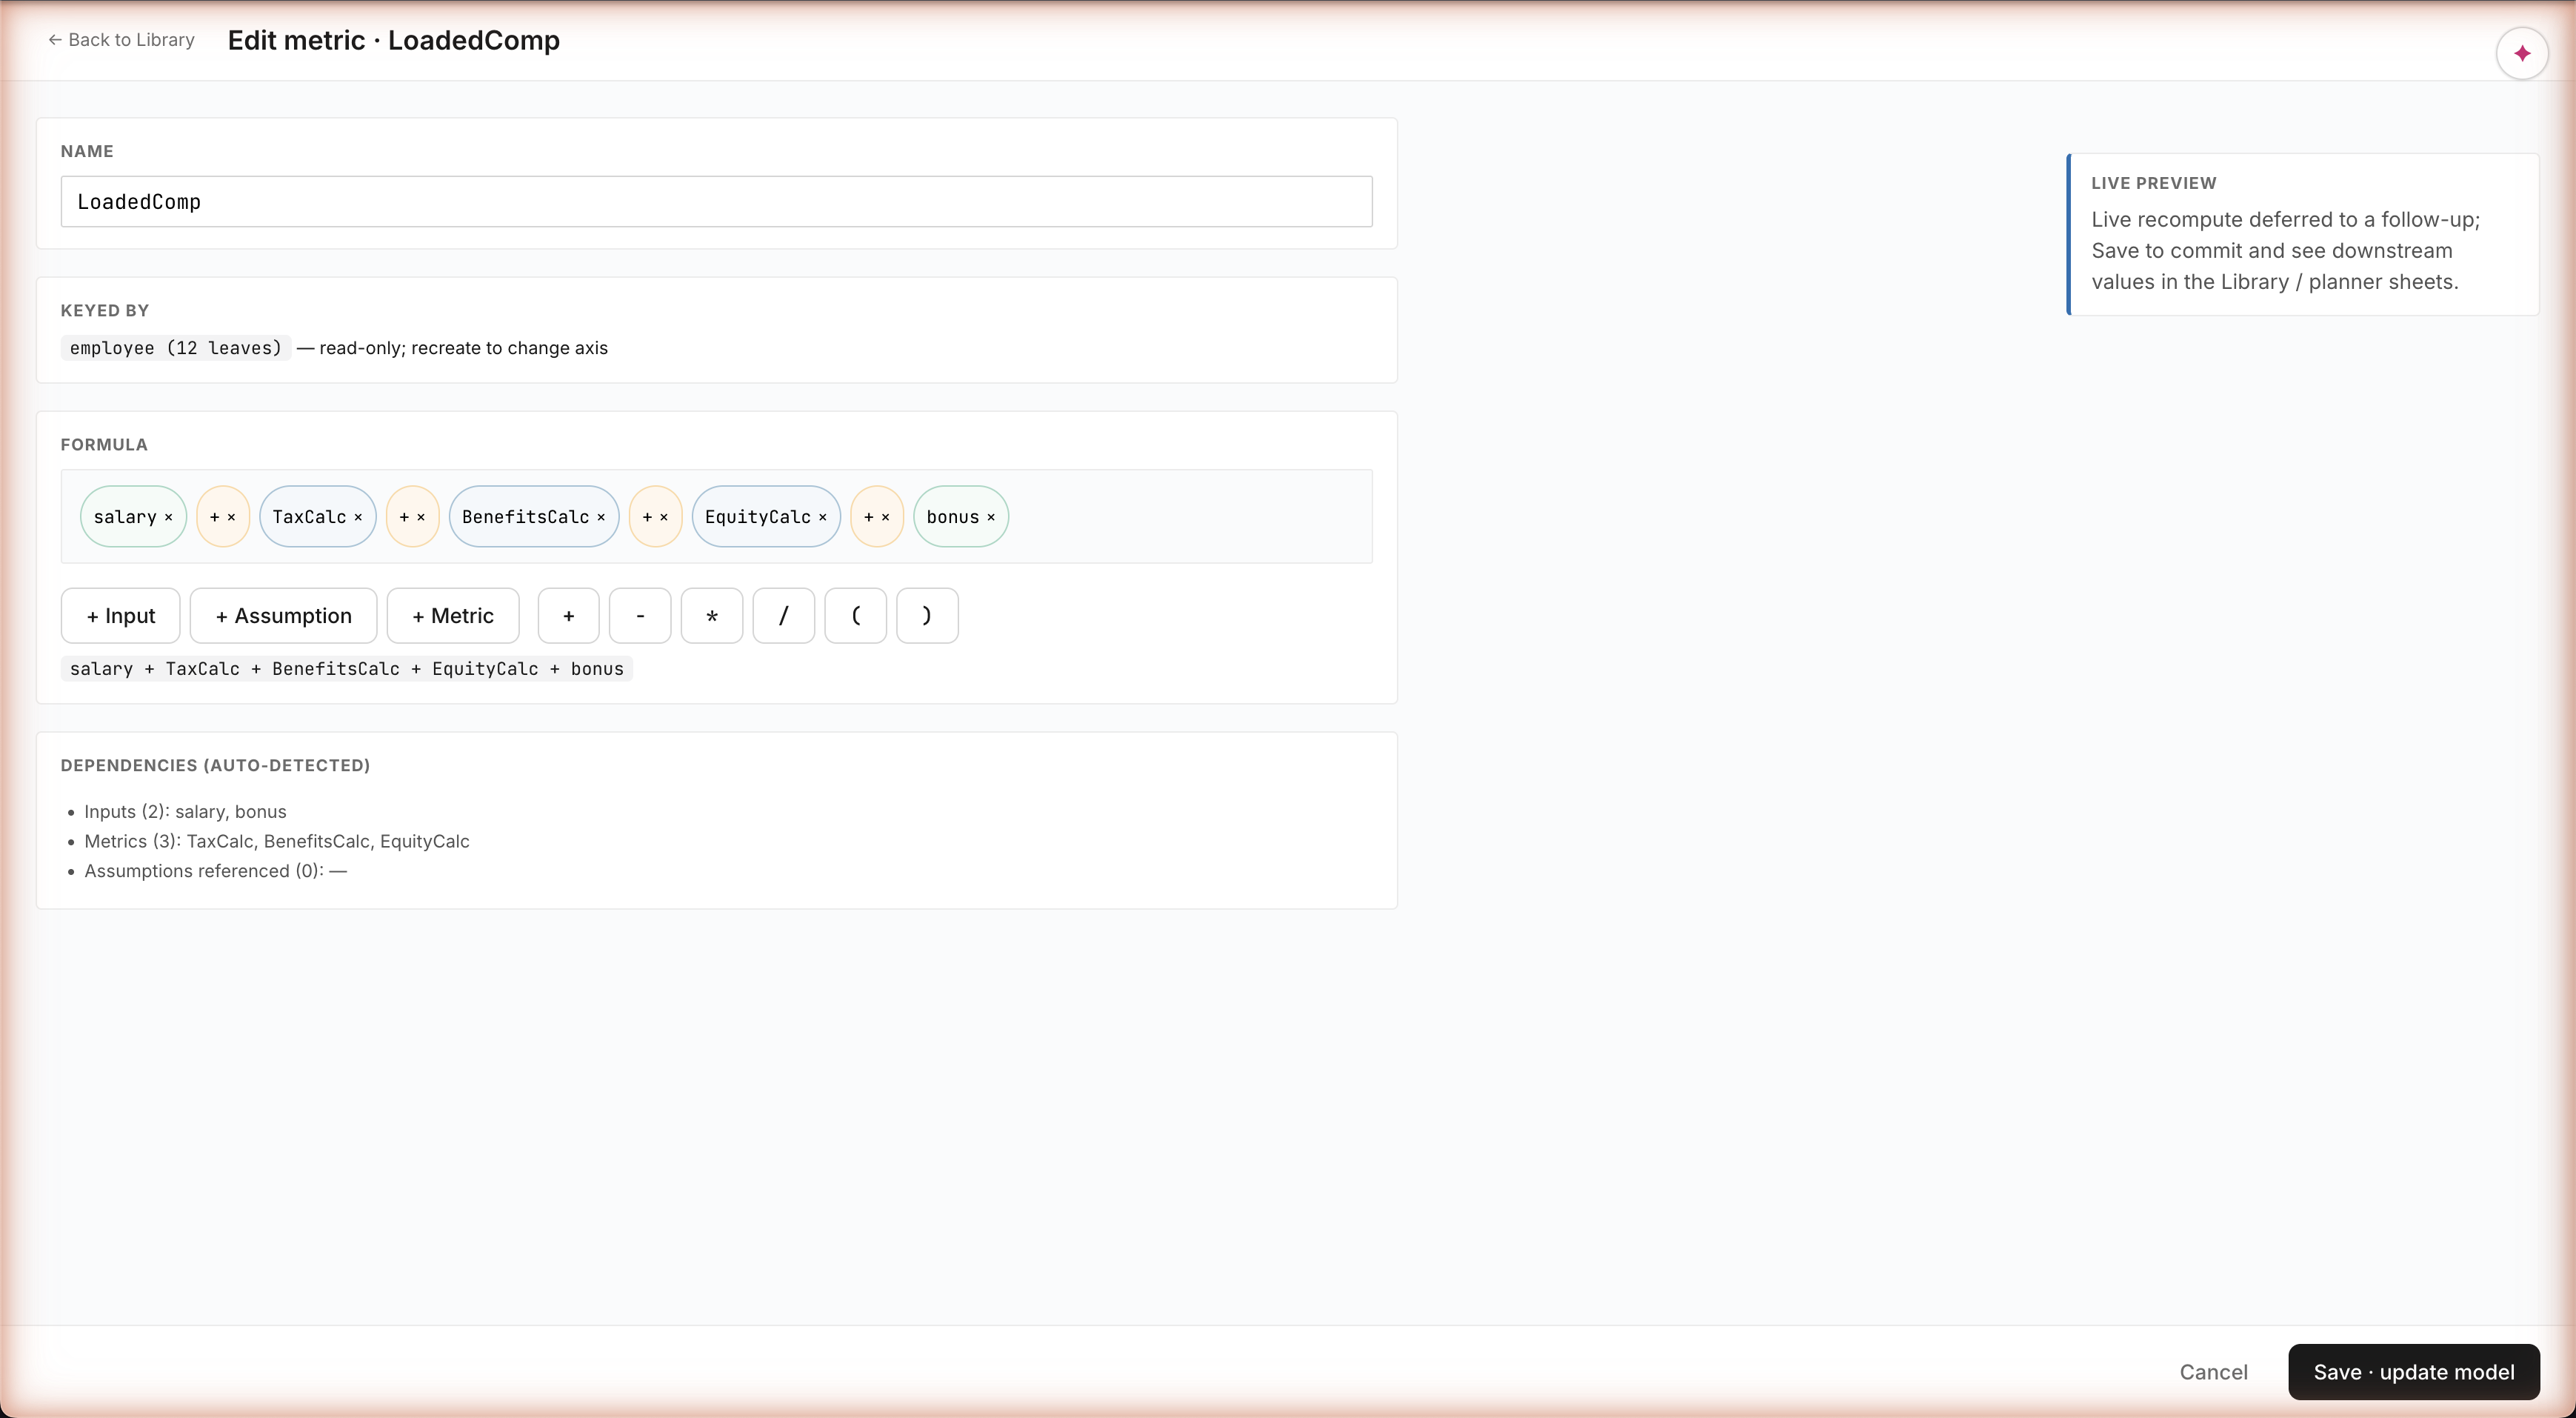
Metric authoring — chip canvas · auto-detected dependencies · cycle detection
Build a formula by clicking
Metric formulas aren't a free-text Excel cell — they're built by clicking typed pieces: a salary chip, a + operator, a TaxCalc chip. Click + Input · + Assumption · + Metric to insert what you need from the catalog. The system auto-detects dependencies as you build and catches circular references before you save. Same engine the agent uses to compose metrics — equal authoring power for the human.
Path B · Build · The prompt
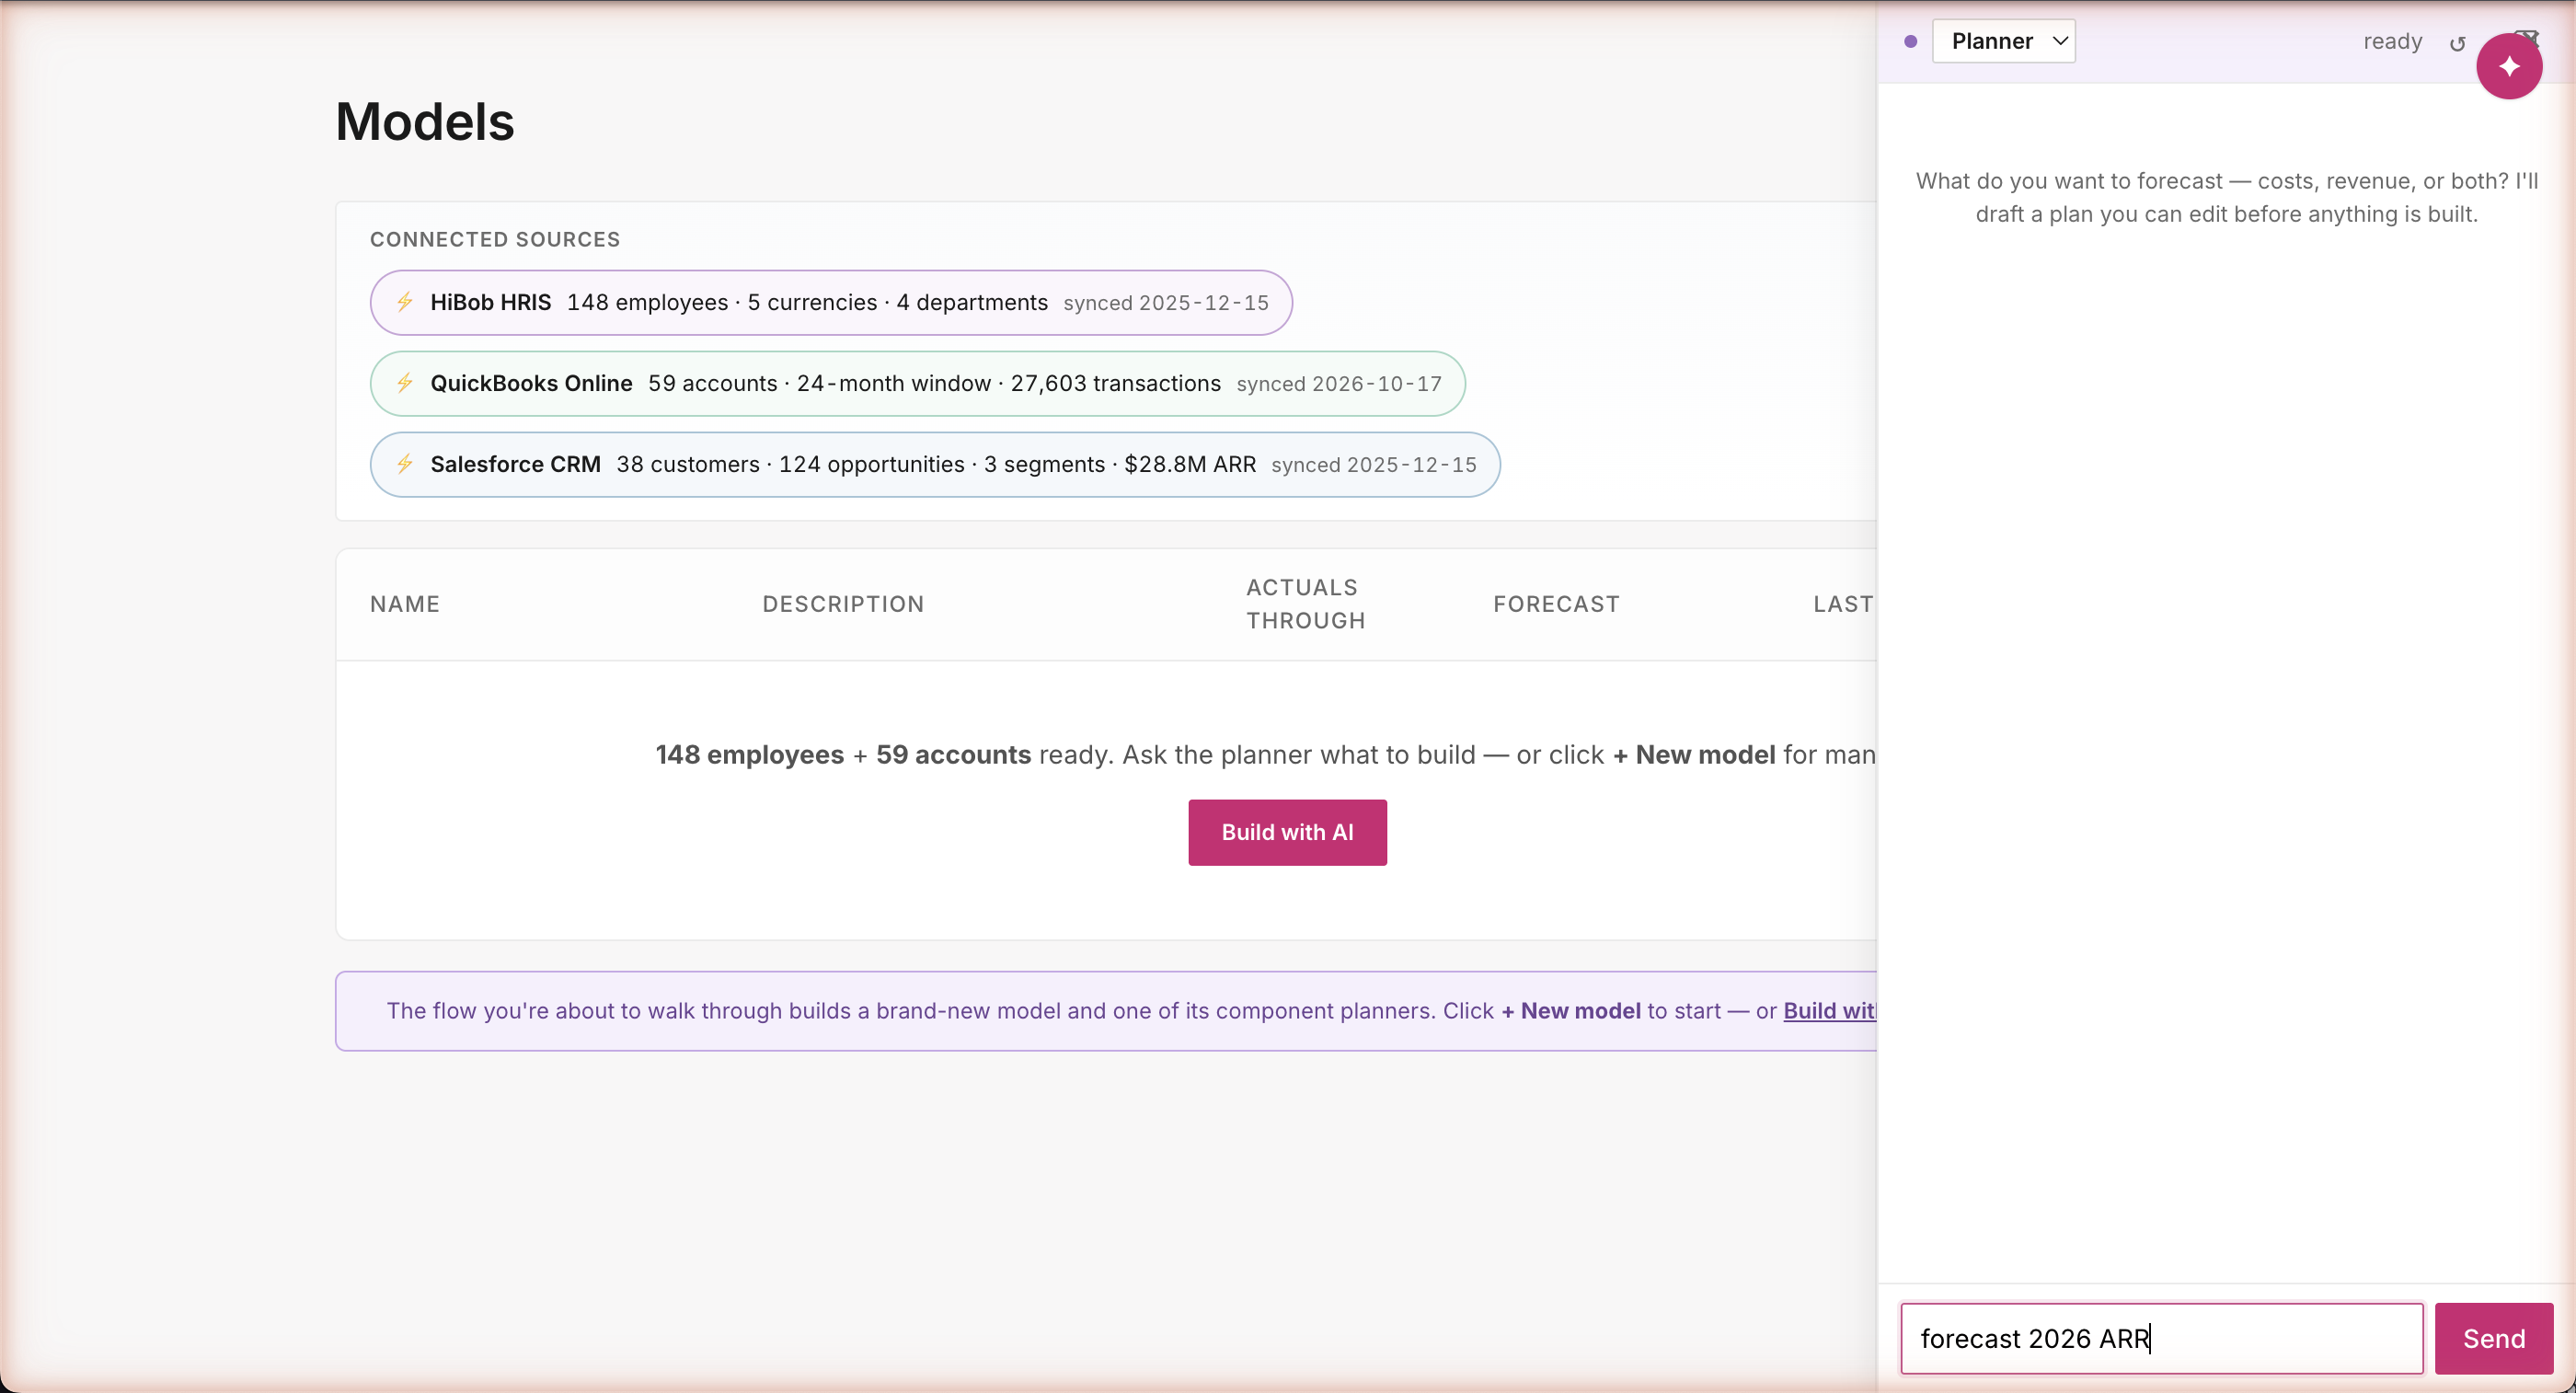
"Forecast 2026 ARR" — three words, full plan
Same playbook · different question
Three words: "forecast 2026 ARR." Salesforce, HiBob, and QuickBooks all visible at the top — but for an ARR question the agent knows to ground in Salesforce ($28.8M current ARR · 124 open opportunities · split across SMB / Mid / Enterprise). The user doesn't pick the connector. The agent picks the connector that matches the question.
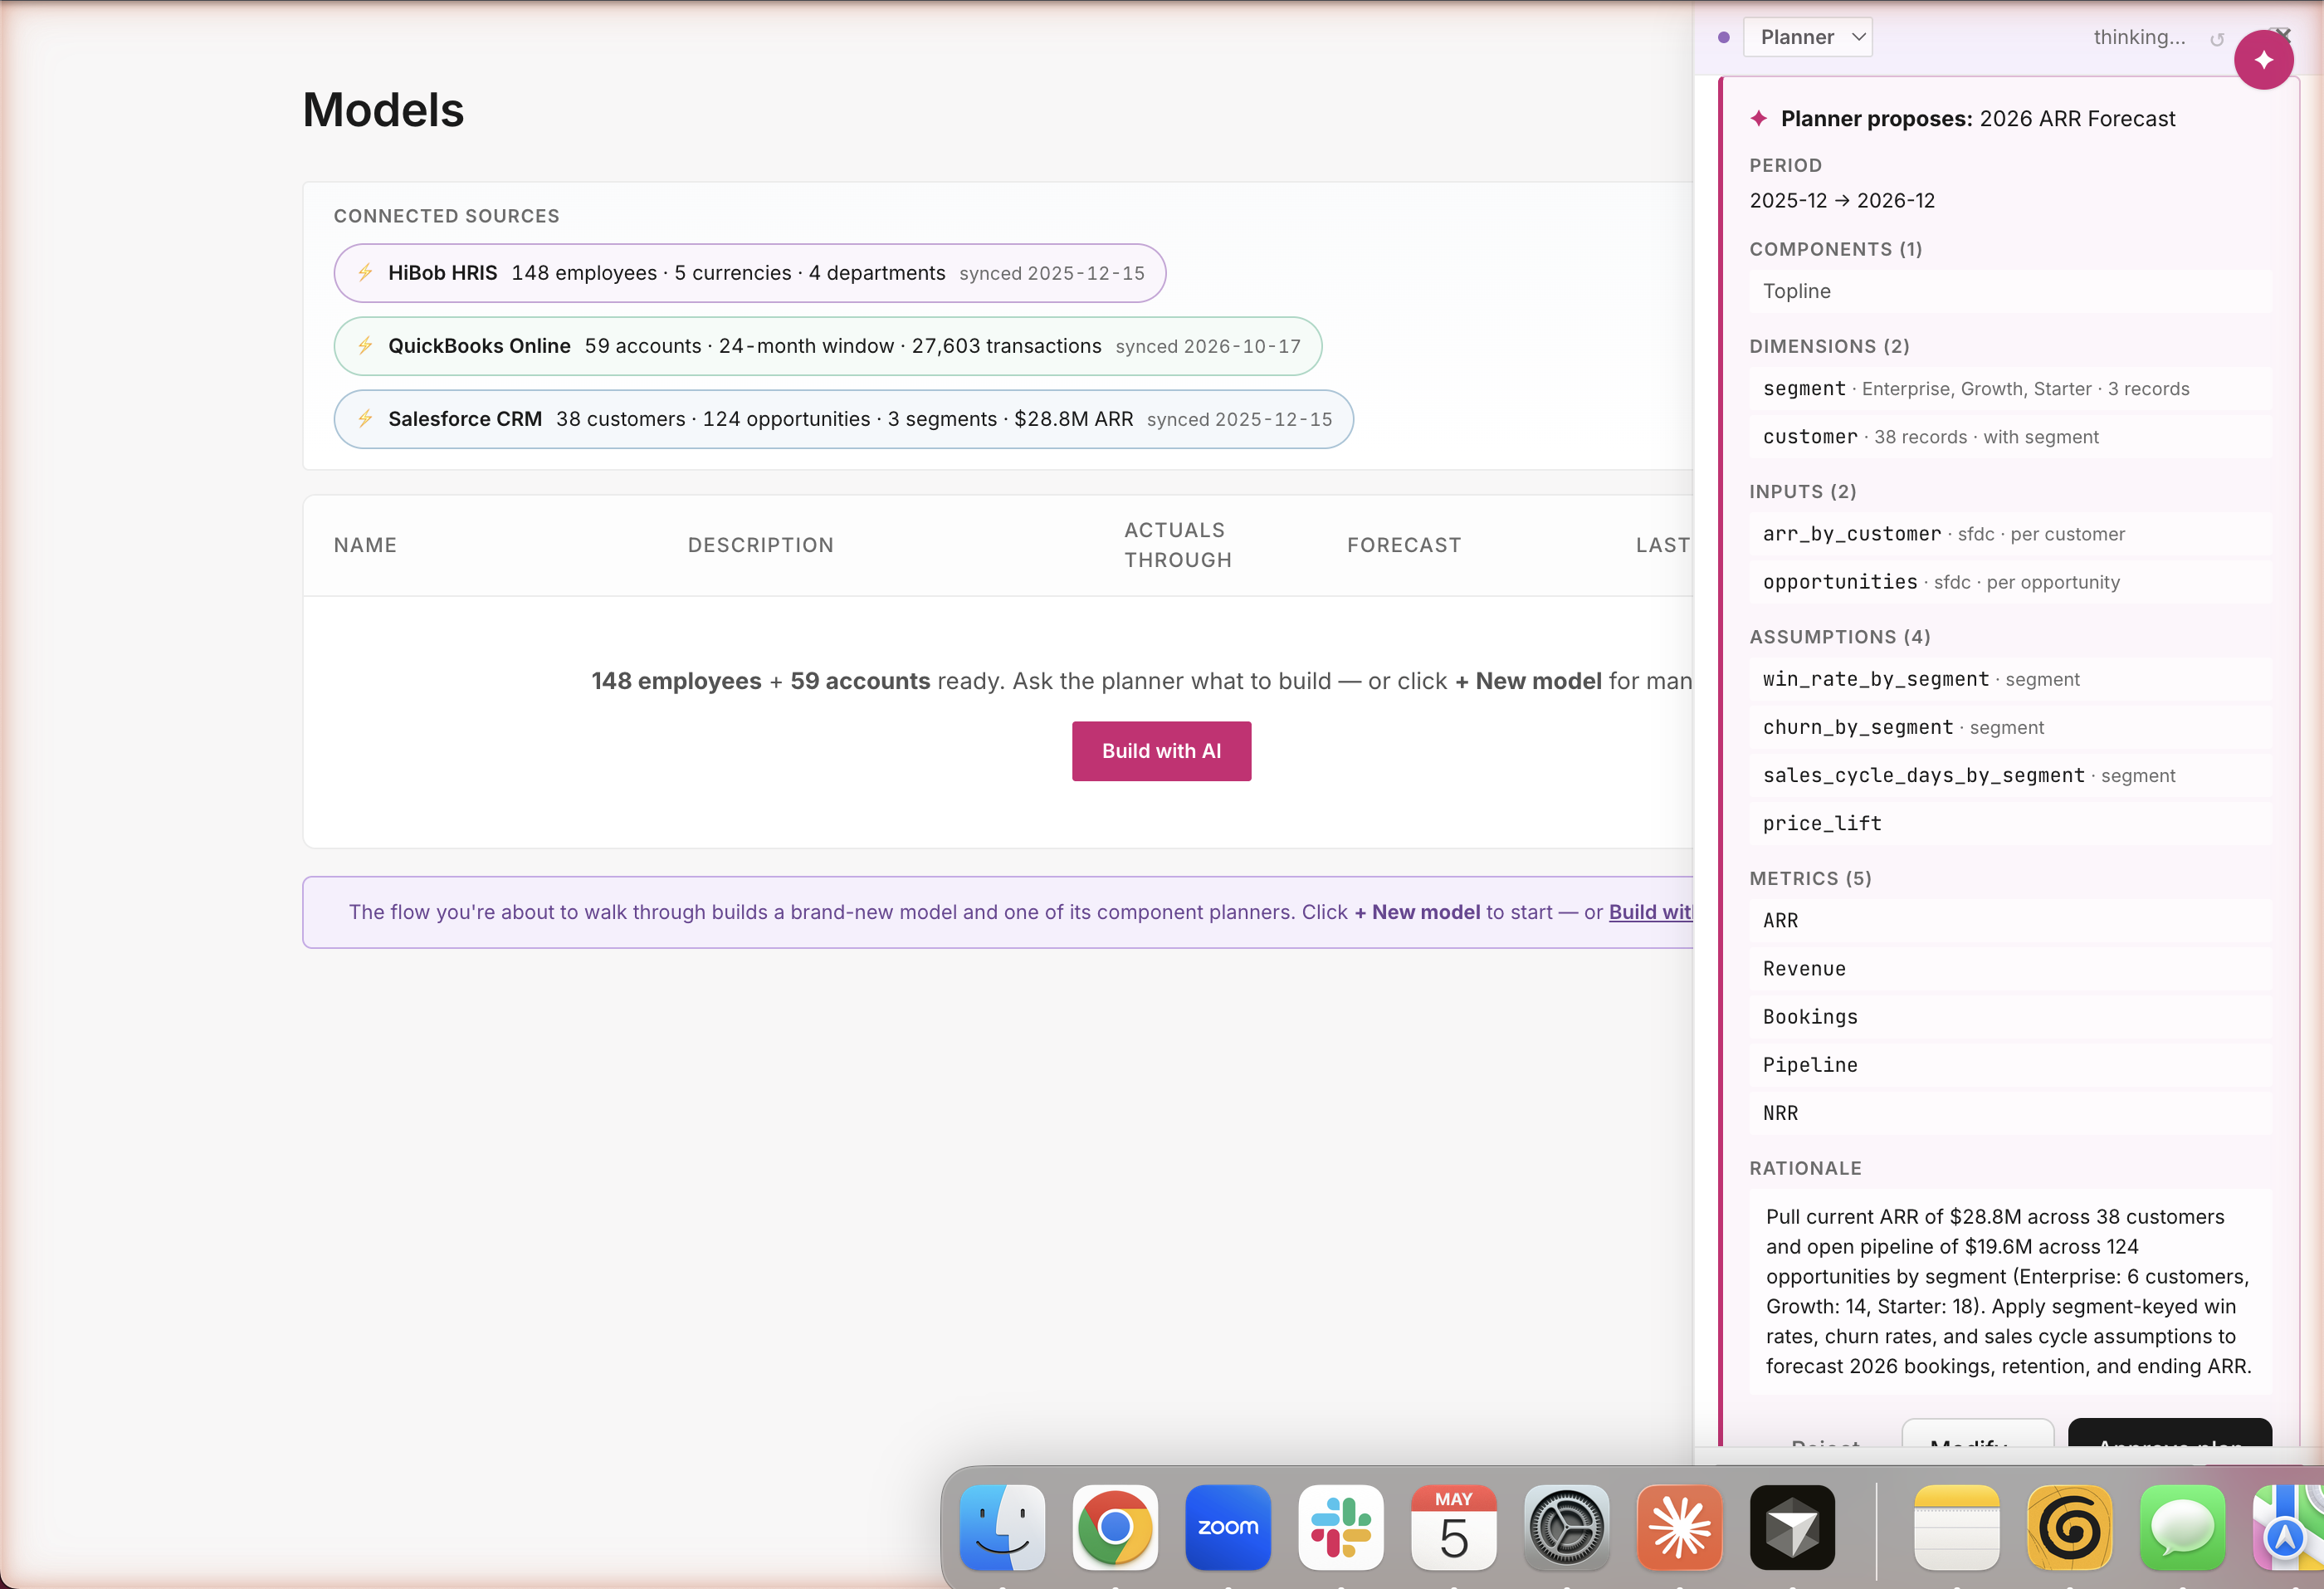
Path B · Build · Planner proposes
One turn · Topline component · connector-grounded
A complete plan from three words
Period: 12 months. Inputs: real customer ARR + open opportunities, both from Salesforce. Assumptions: win rate by segment, churn by segment, sales cycle, price lift. Metrics: ARR, Revenue, Bookings, Pipeline, Net Retention. The agent picks all of this from a catalog of standard SaaS forecasting building blocks — and cites real numbers in the rationale: $28.8M across 38 customers · $19.6M pipeline across 124 opportunities. Same approval gate; nothing builds until you say go.
Path B · Build · Builder executes
Builder runs from [APPROVED PLAN] · same audit trail
Same machinery, different job
Same plan-approval handoff, same audit trail, same one-decision flow. The Builder reads the approved plan and runs ~12 actions in sequence — create the model, define the segments, bind the Salesforce inputs, register the four SaaS assumptions, build the five revenue metrics. Visible in the chat as it happens. No new architecture, no new agent code — just the agent's vocabulary being put to work on a different question.
Path B · Build · Analyst closes
Closes citing 38 customers · $28.8M ARR · 89-101% NRR
The agent narrates a model it actually built
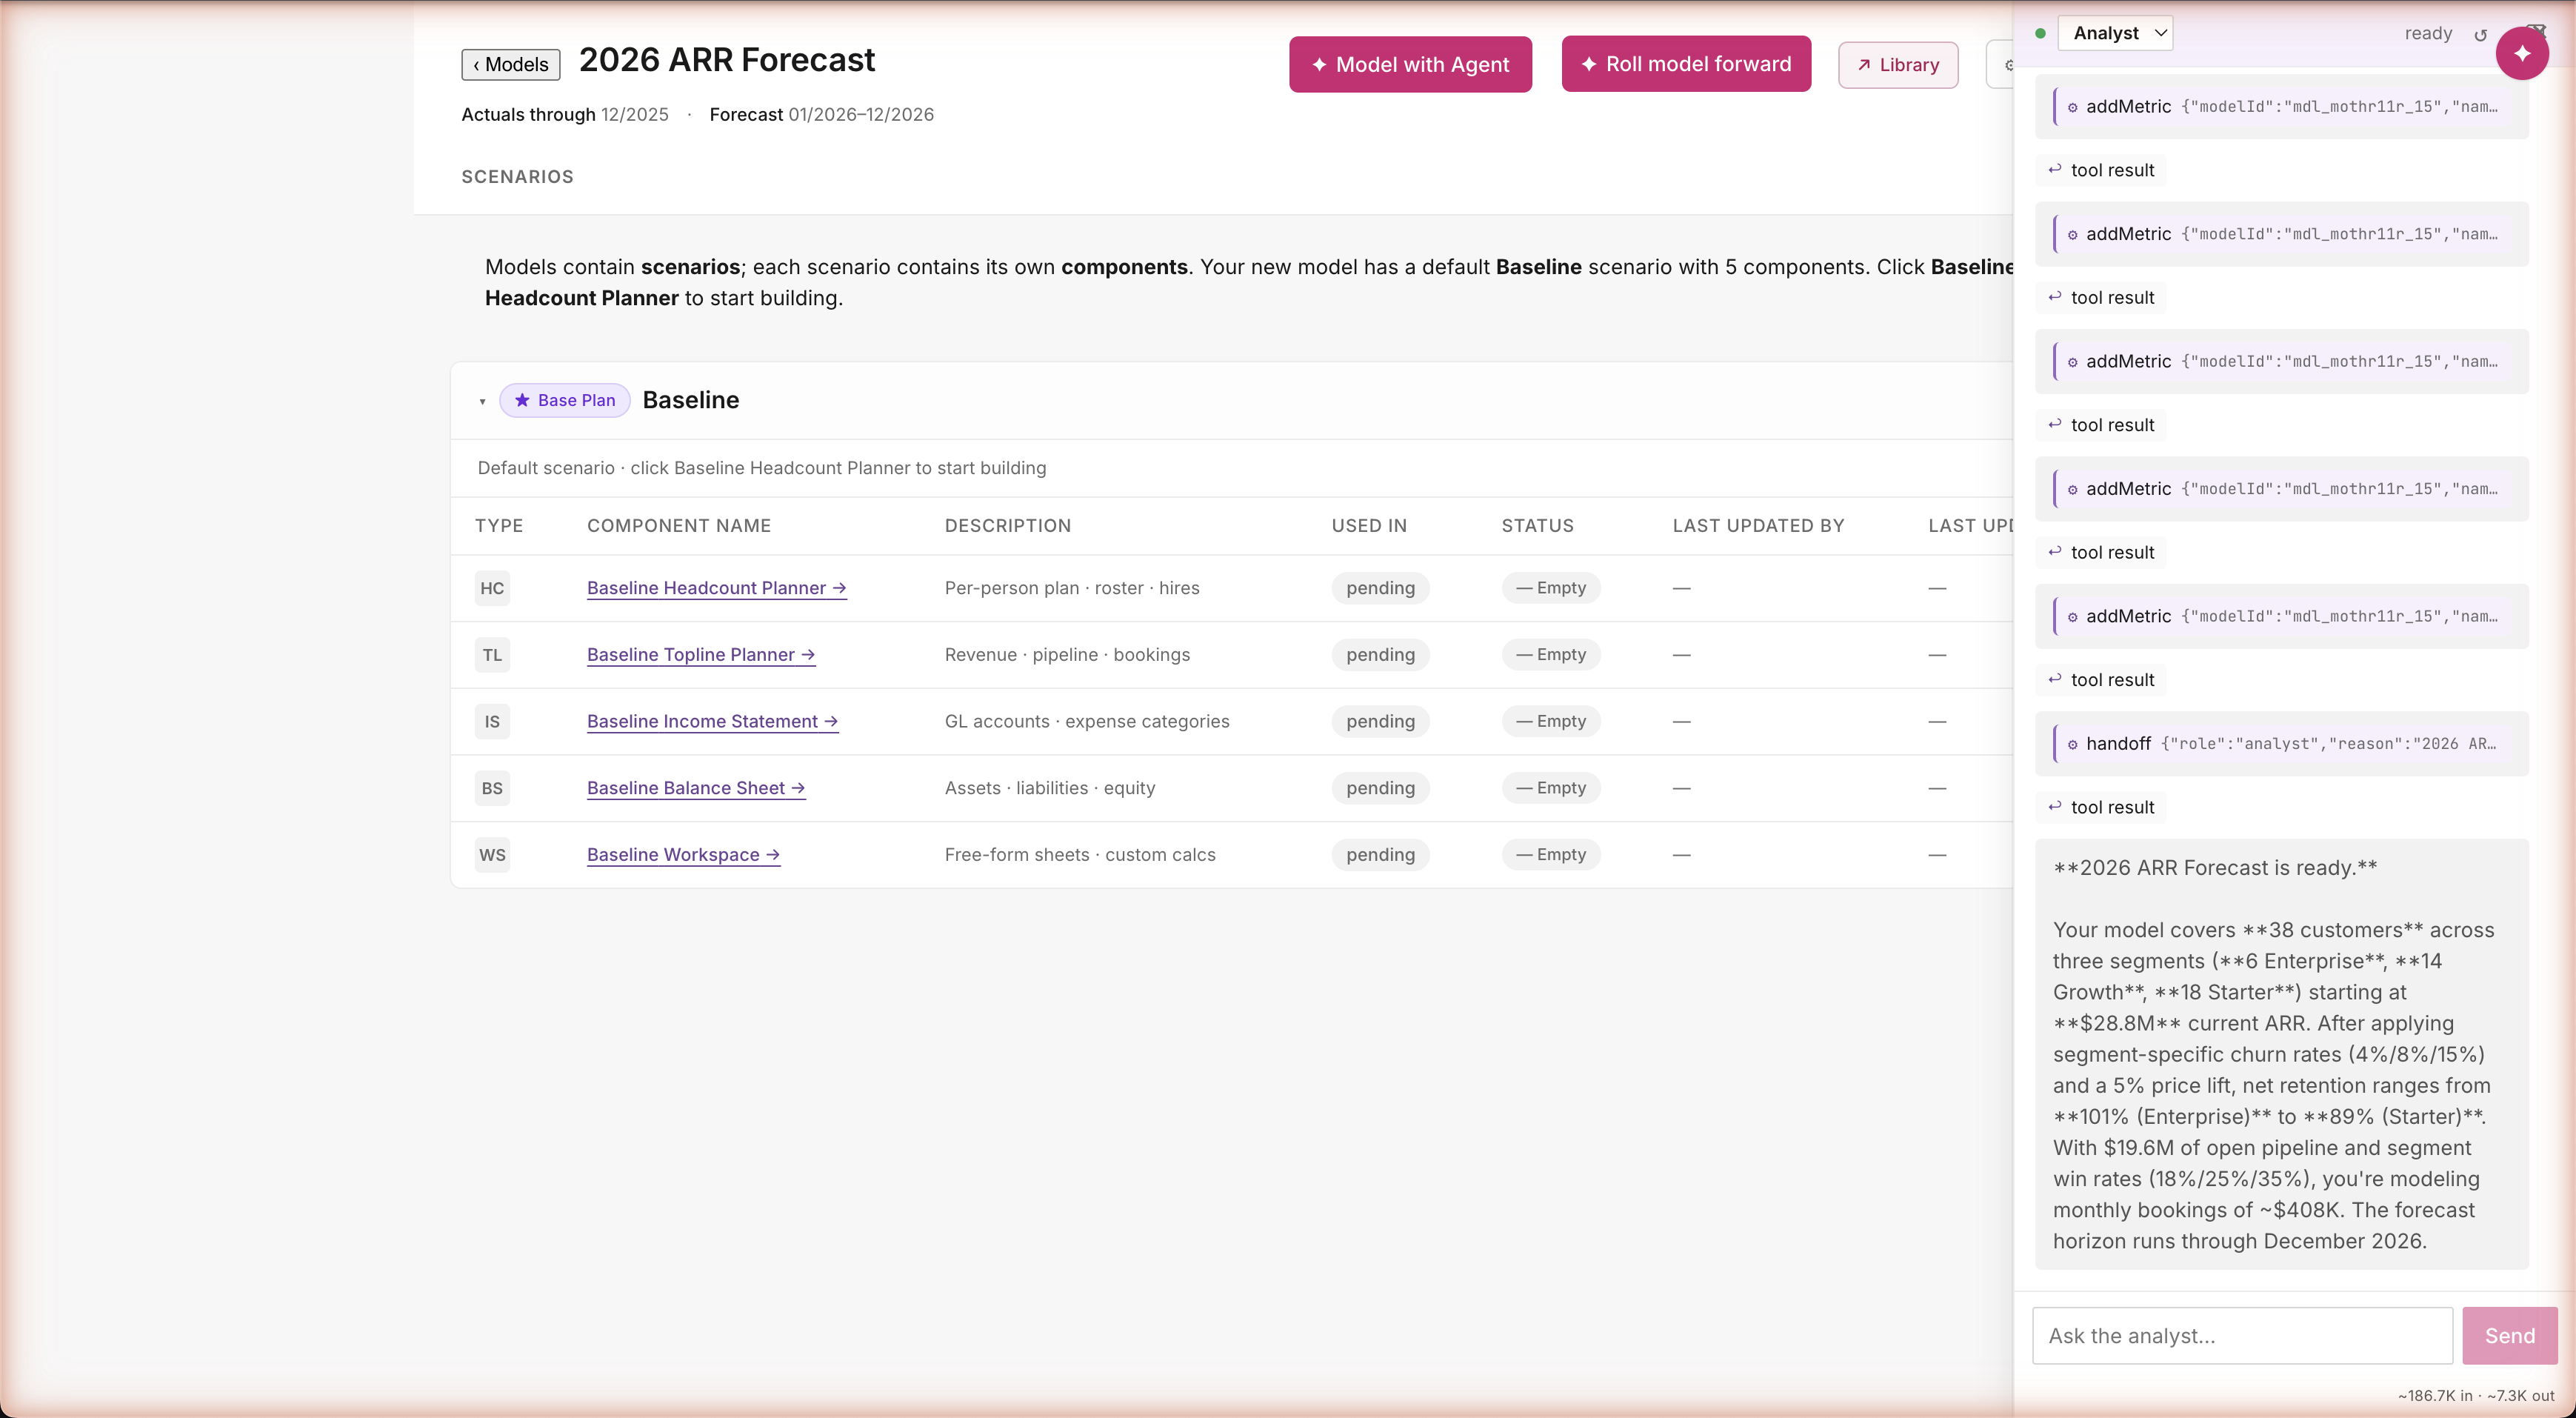
"2026 ARR Forecast is ready. 38 customers across three segments. $28.8M current ARR. Churn rates 4%/8%/15% by segment. Win rates 18%/25%/35%. Net retention ranges 101% (Enterprise) down to 89% (Starter). Monthly bookings ~$408K." Every number computed live from the model the agent just stood up. Not summarized from a chat transcript — read off the working sheet.
Path B · Build · The plan, ready to use
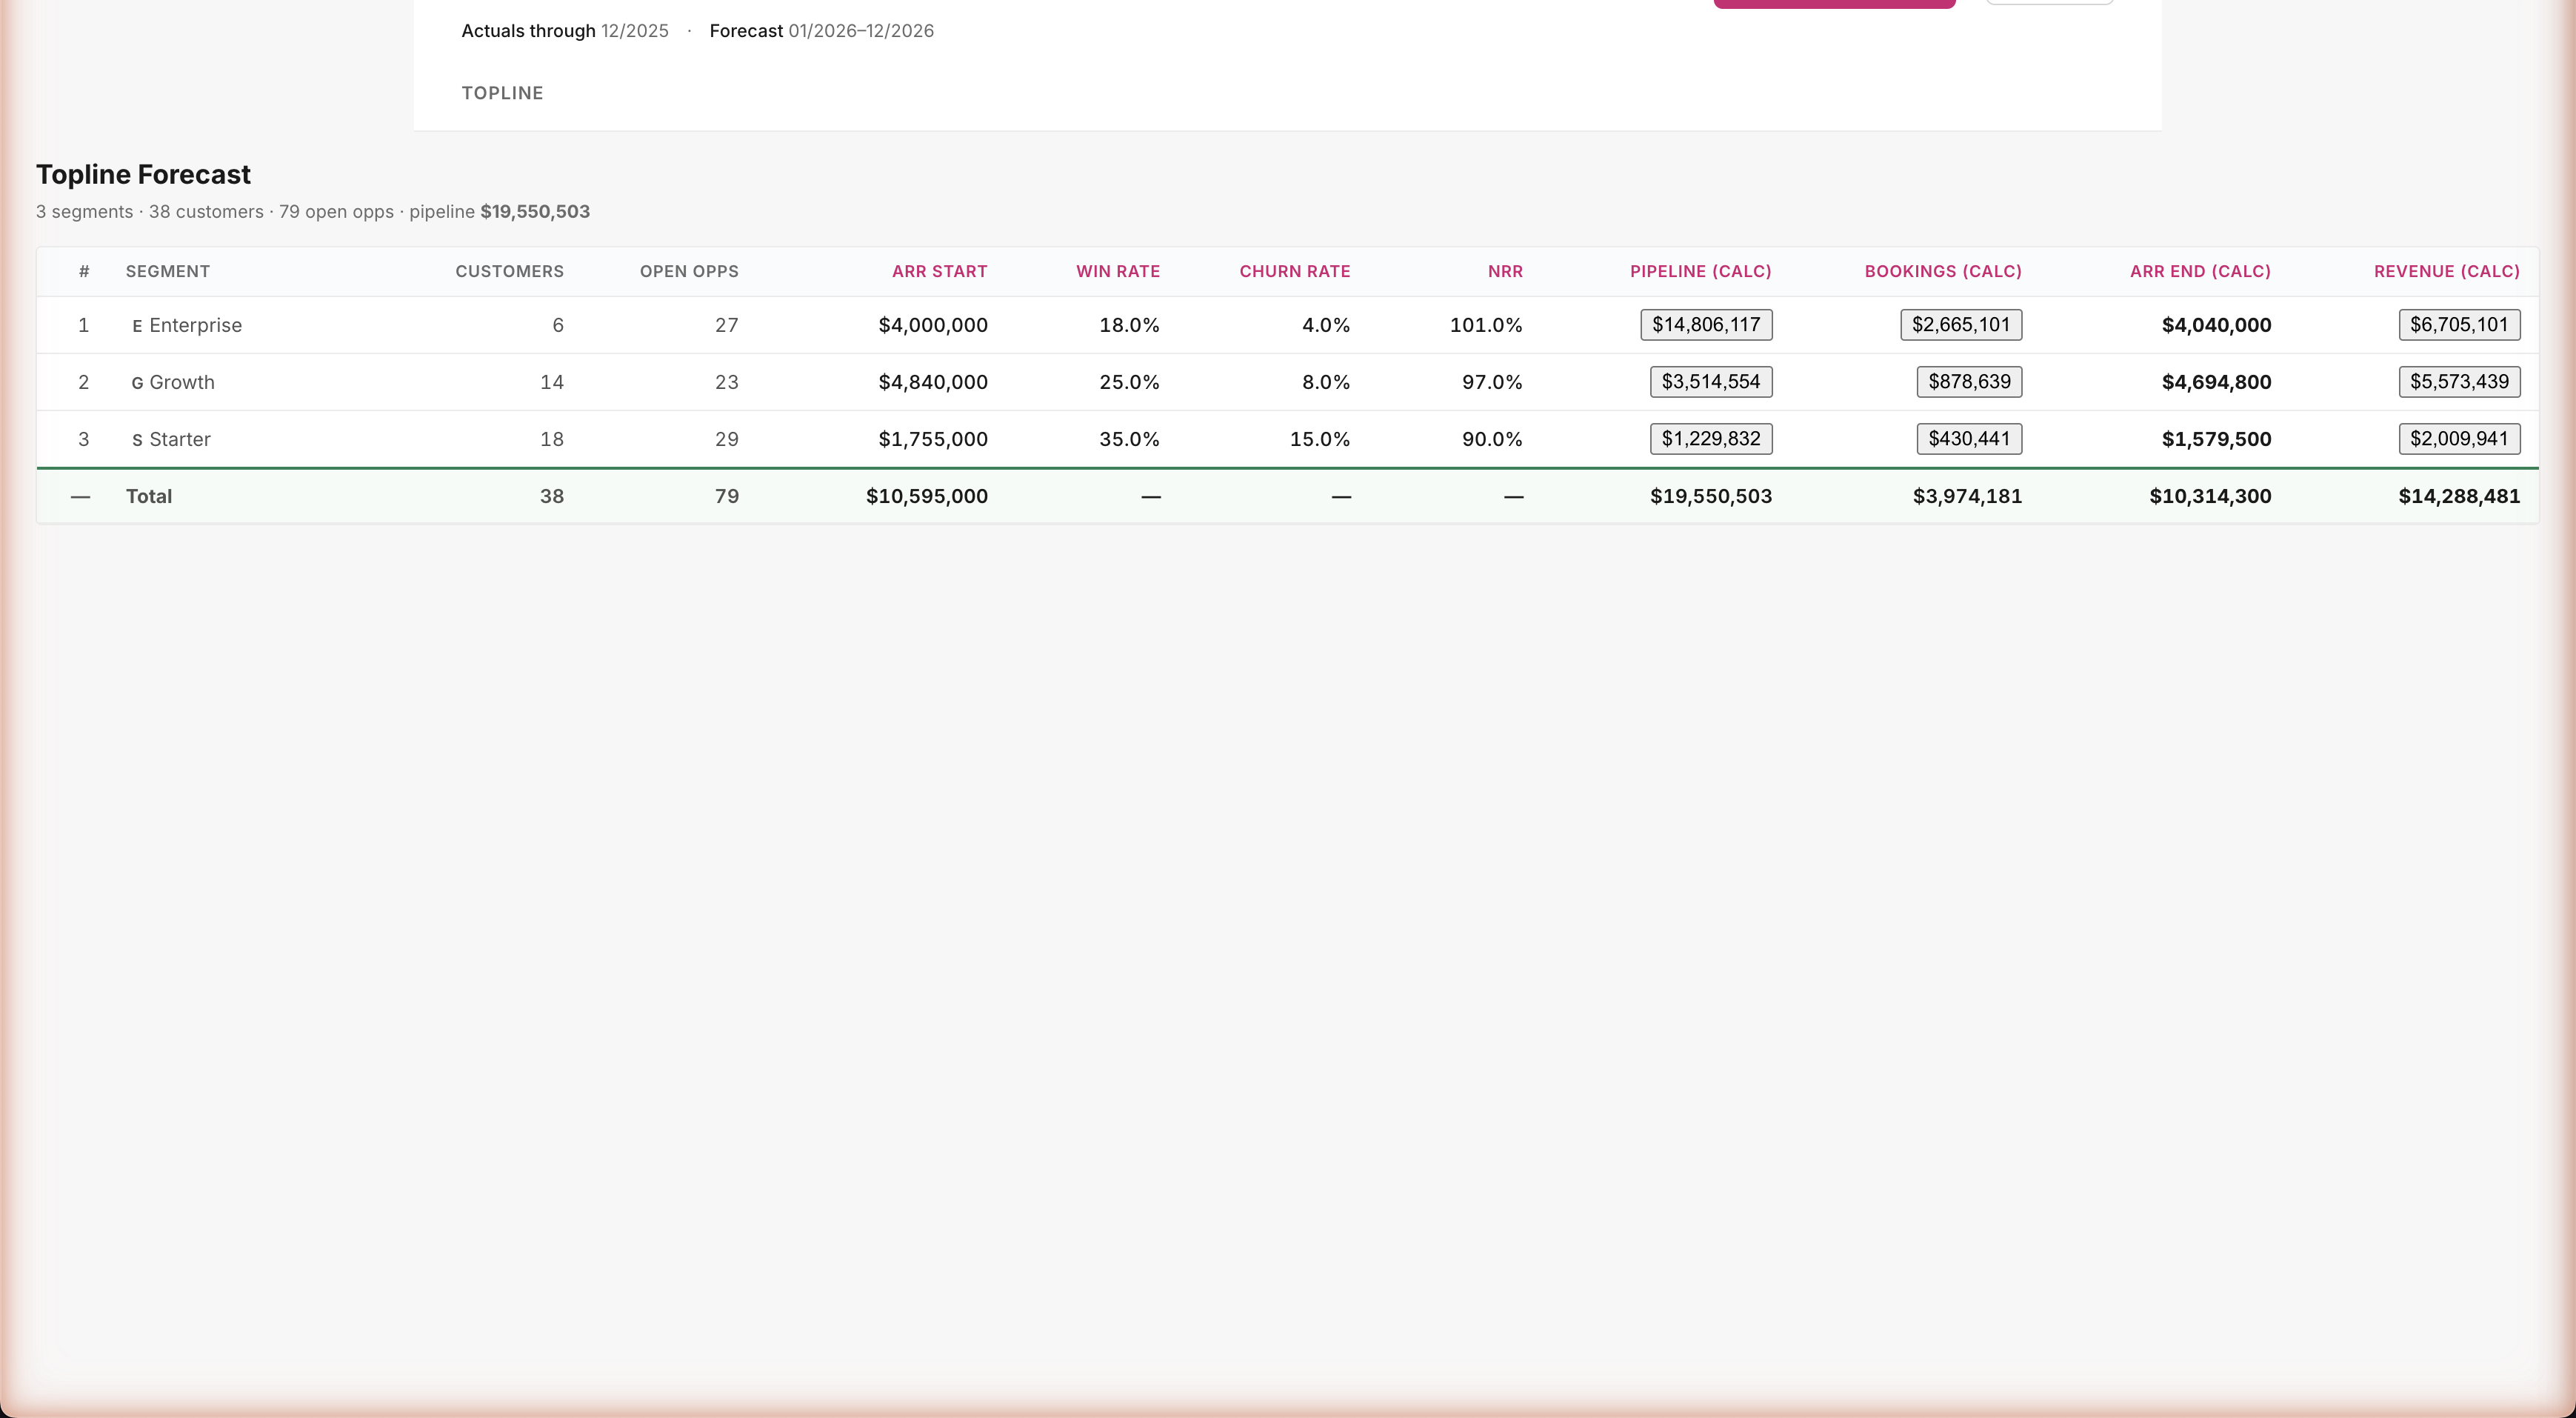
Agent-built Topline Planner — $14.3M revenue forecast, all sourced
Real model, real numbers, real audit
Three segment rows: Enterprise, Growth, Starter. Twelve columns: customers, open opps, ARR start, win rate, churn, NRR, pipeline, bookings, ARR end, revenue. Total: $14.3M revenue forecast for 2026. The agent made its own modeling choices — picked SaaS industry benchmark win rates (18% / 25% / 35%) and a per-month bookings formula. Both choices are visible when you click into any metric. Audit complete.
Post-demo · PR16
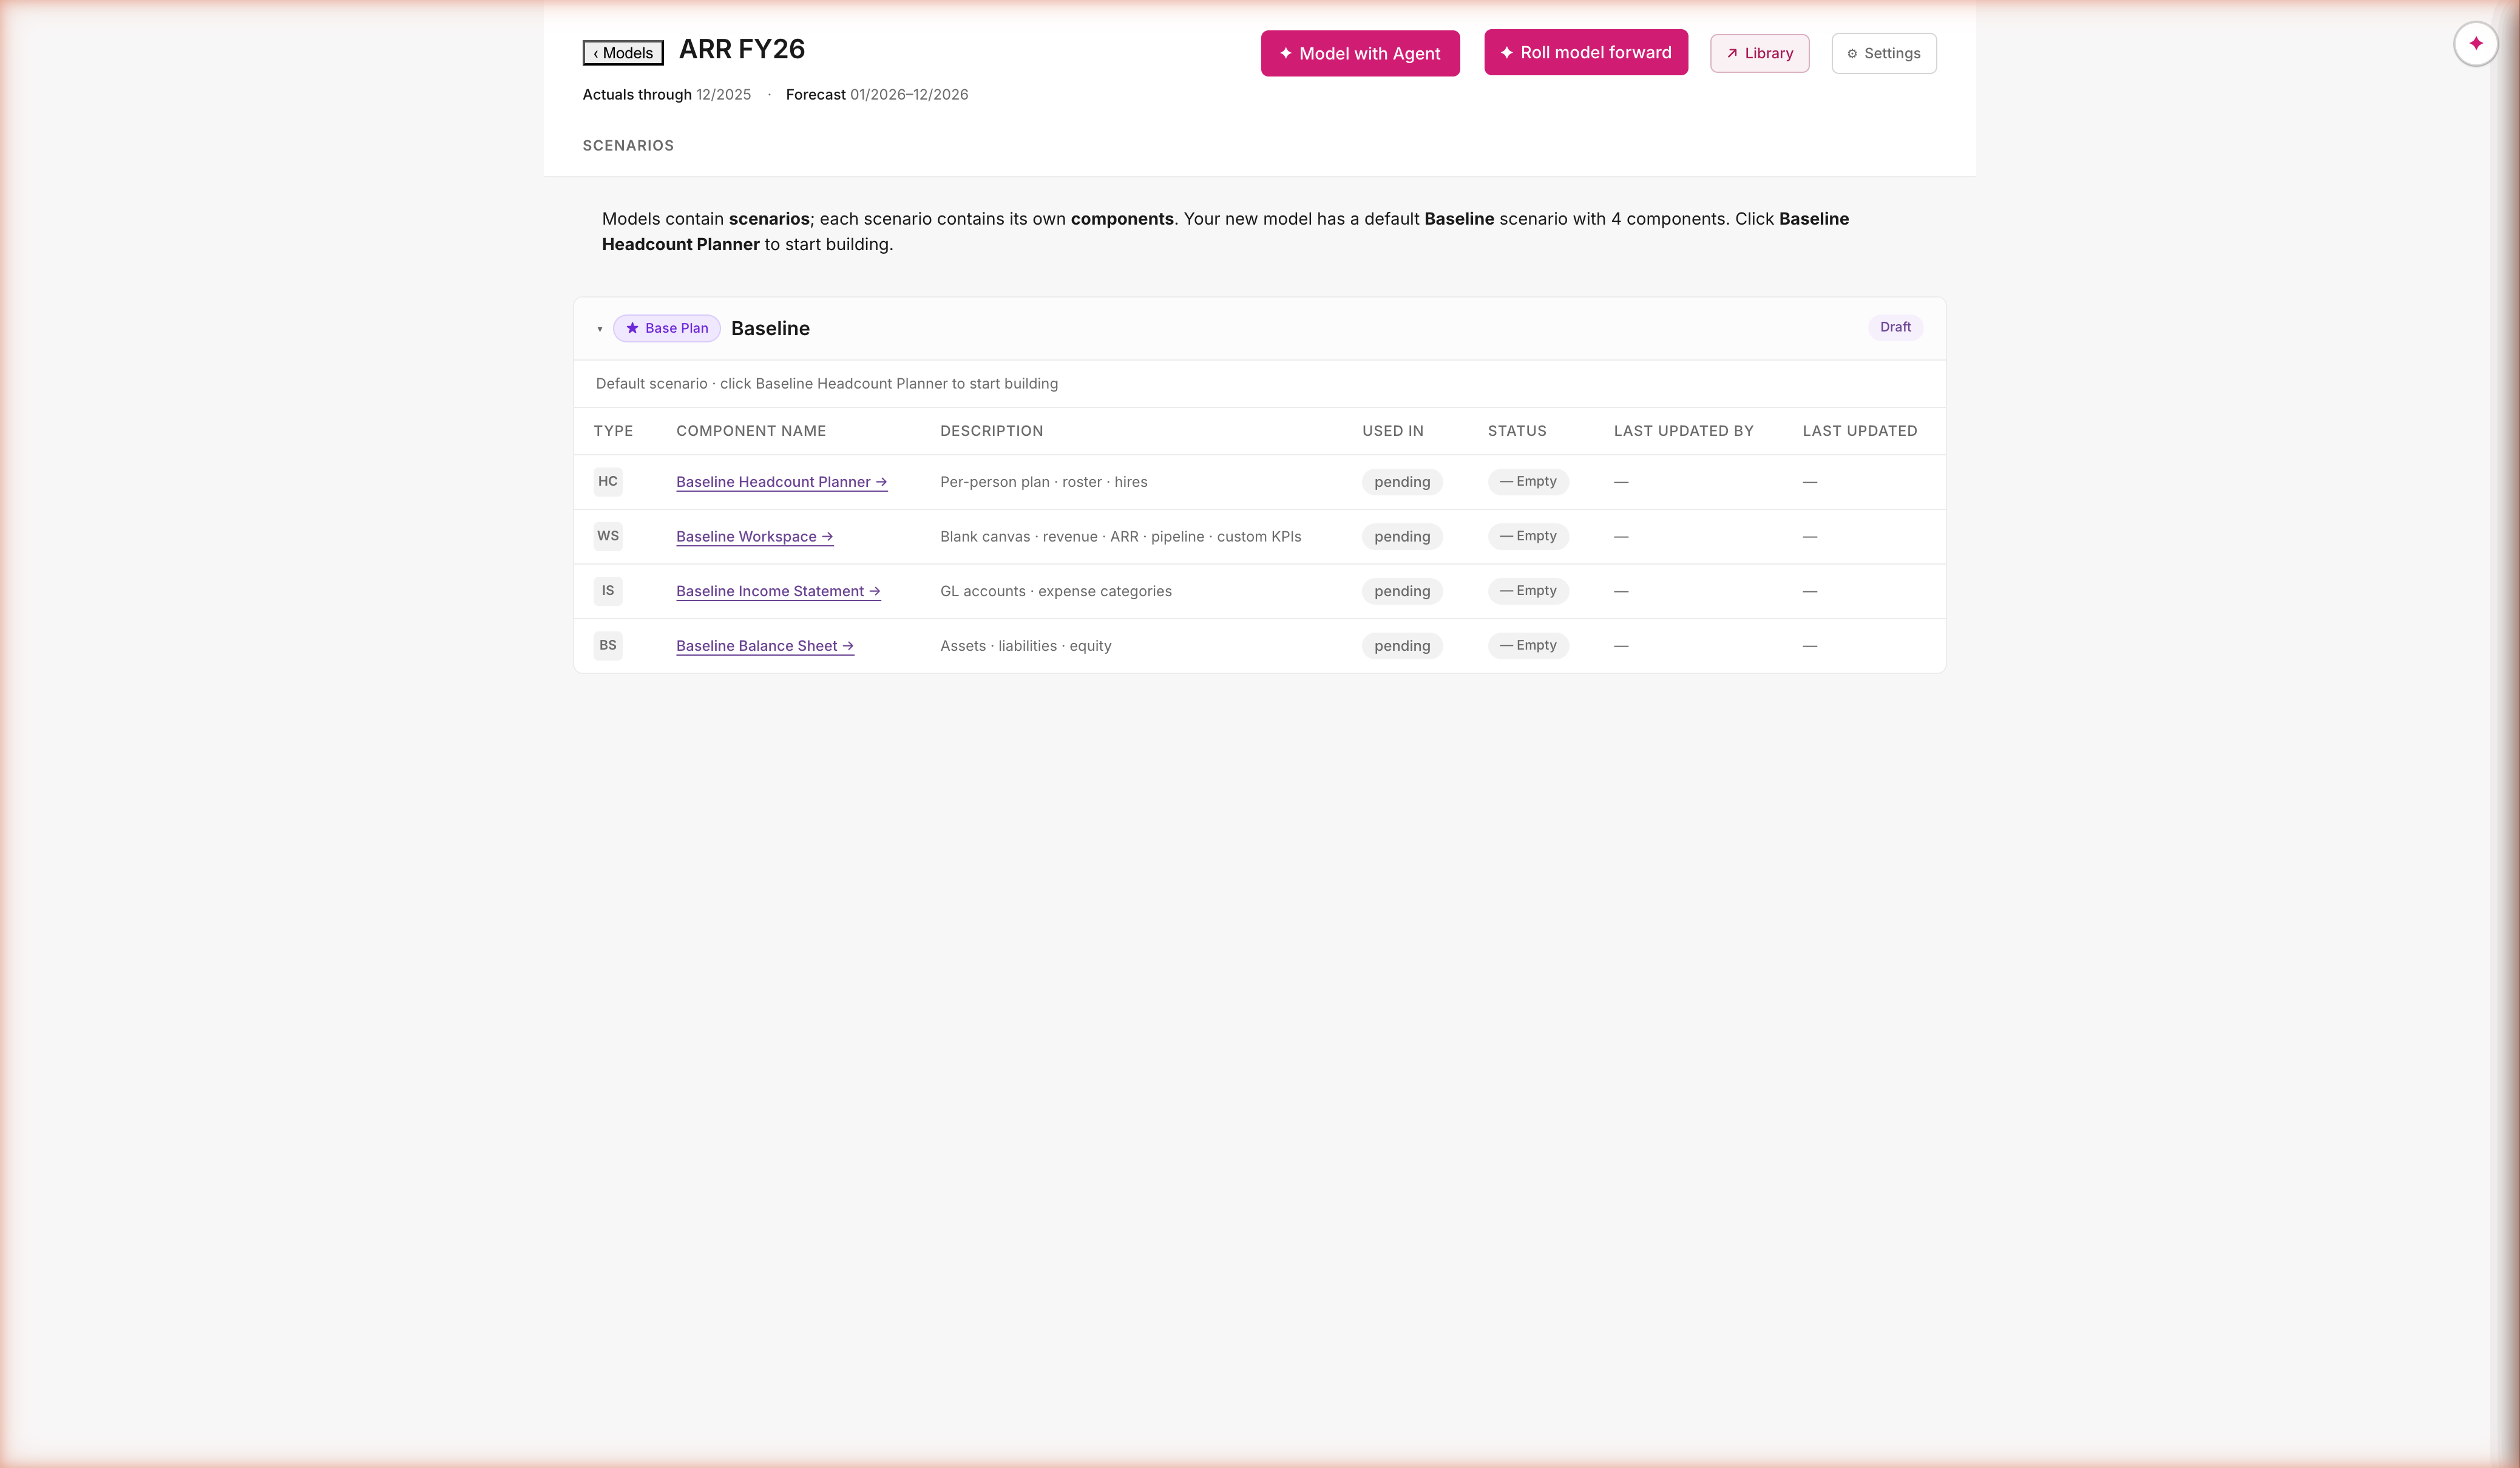
Income Statement, same pattern, second component
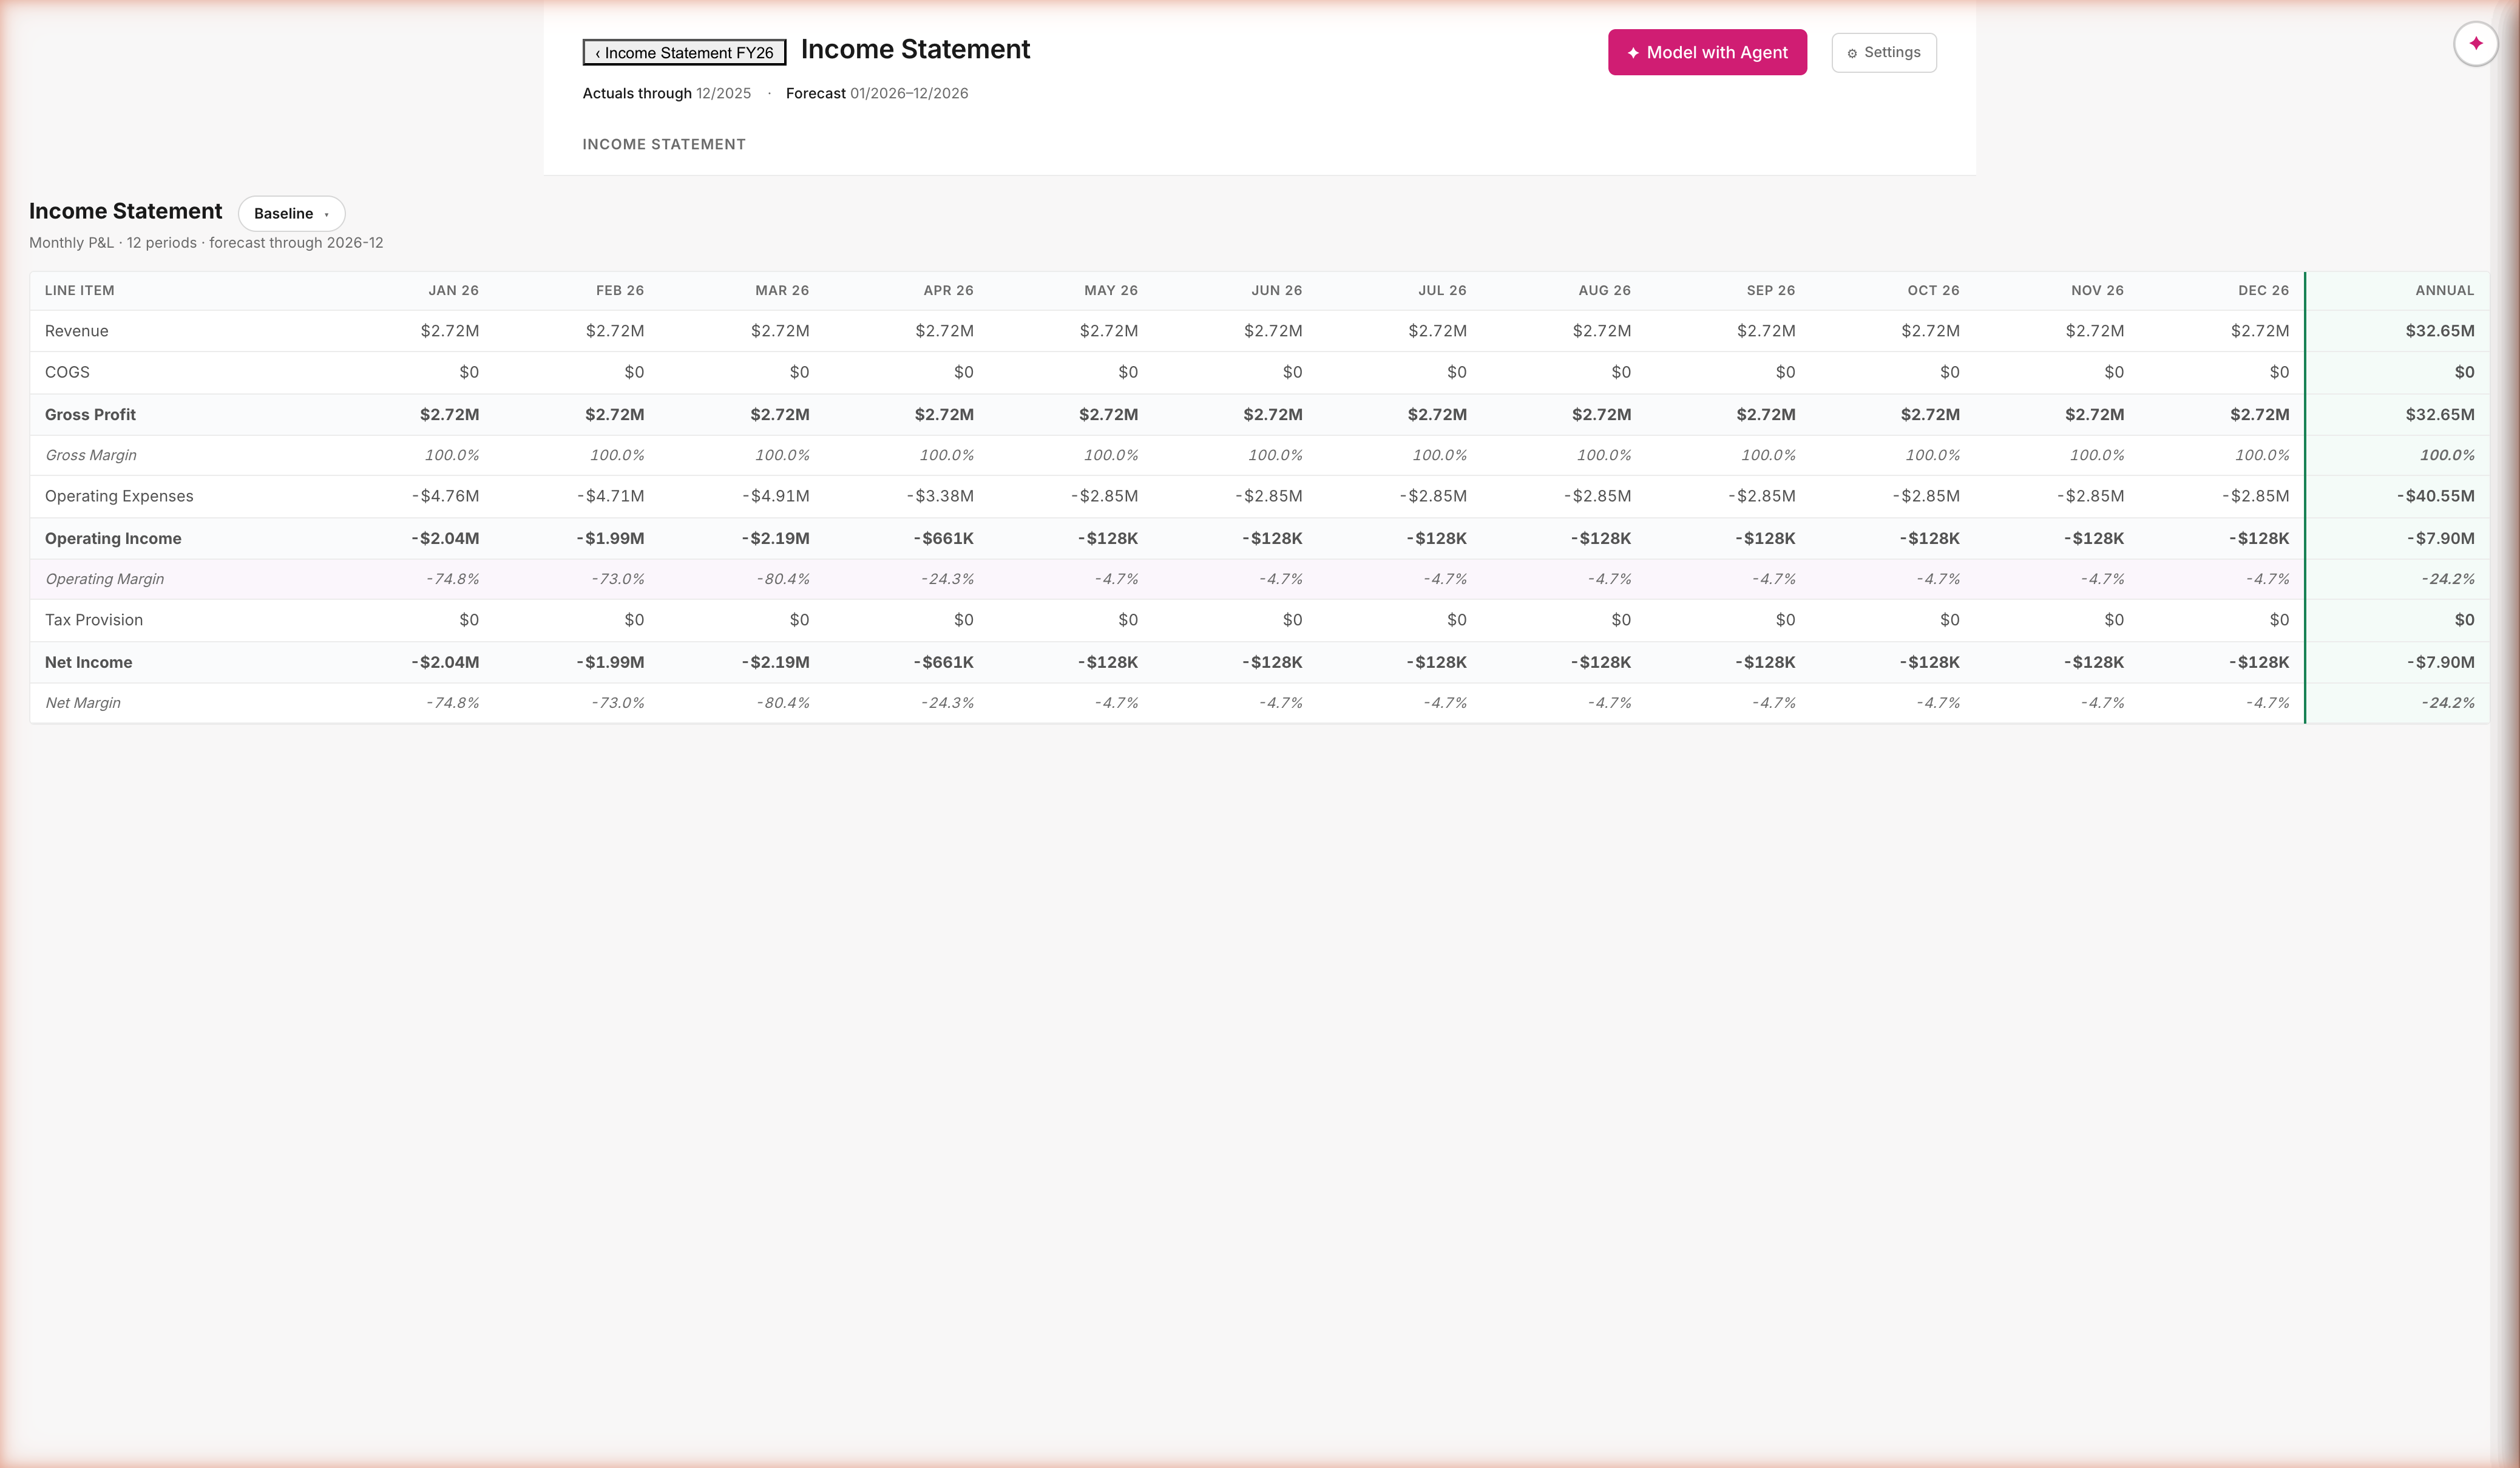
GL accounts pre-populate; the rest is the same shape as Headcount
Components are differentiated by what they pre-populate from. Headcount pre-populates from the Hibob roster. IS pre-populates from the GL. Same engine, same provenance, same plan-first agent flow — just a different starting dataset. The Baseline scenario chip is the entry point to PR18.
Post-demo · PR18
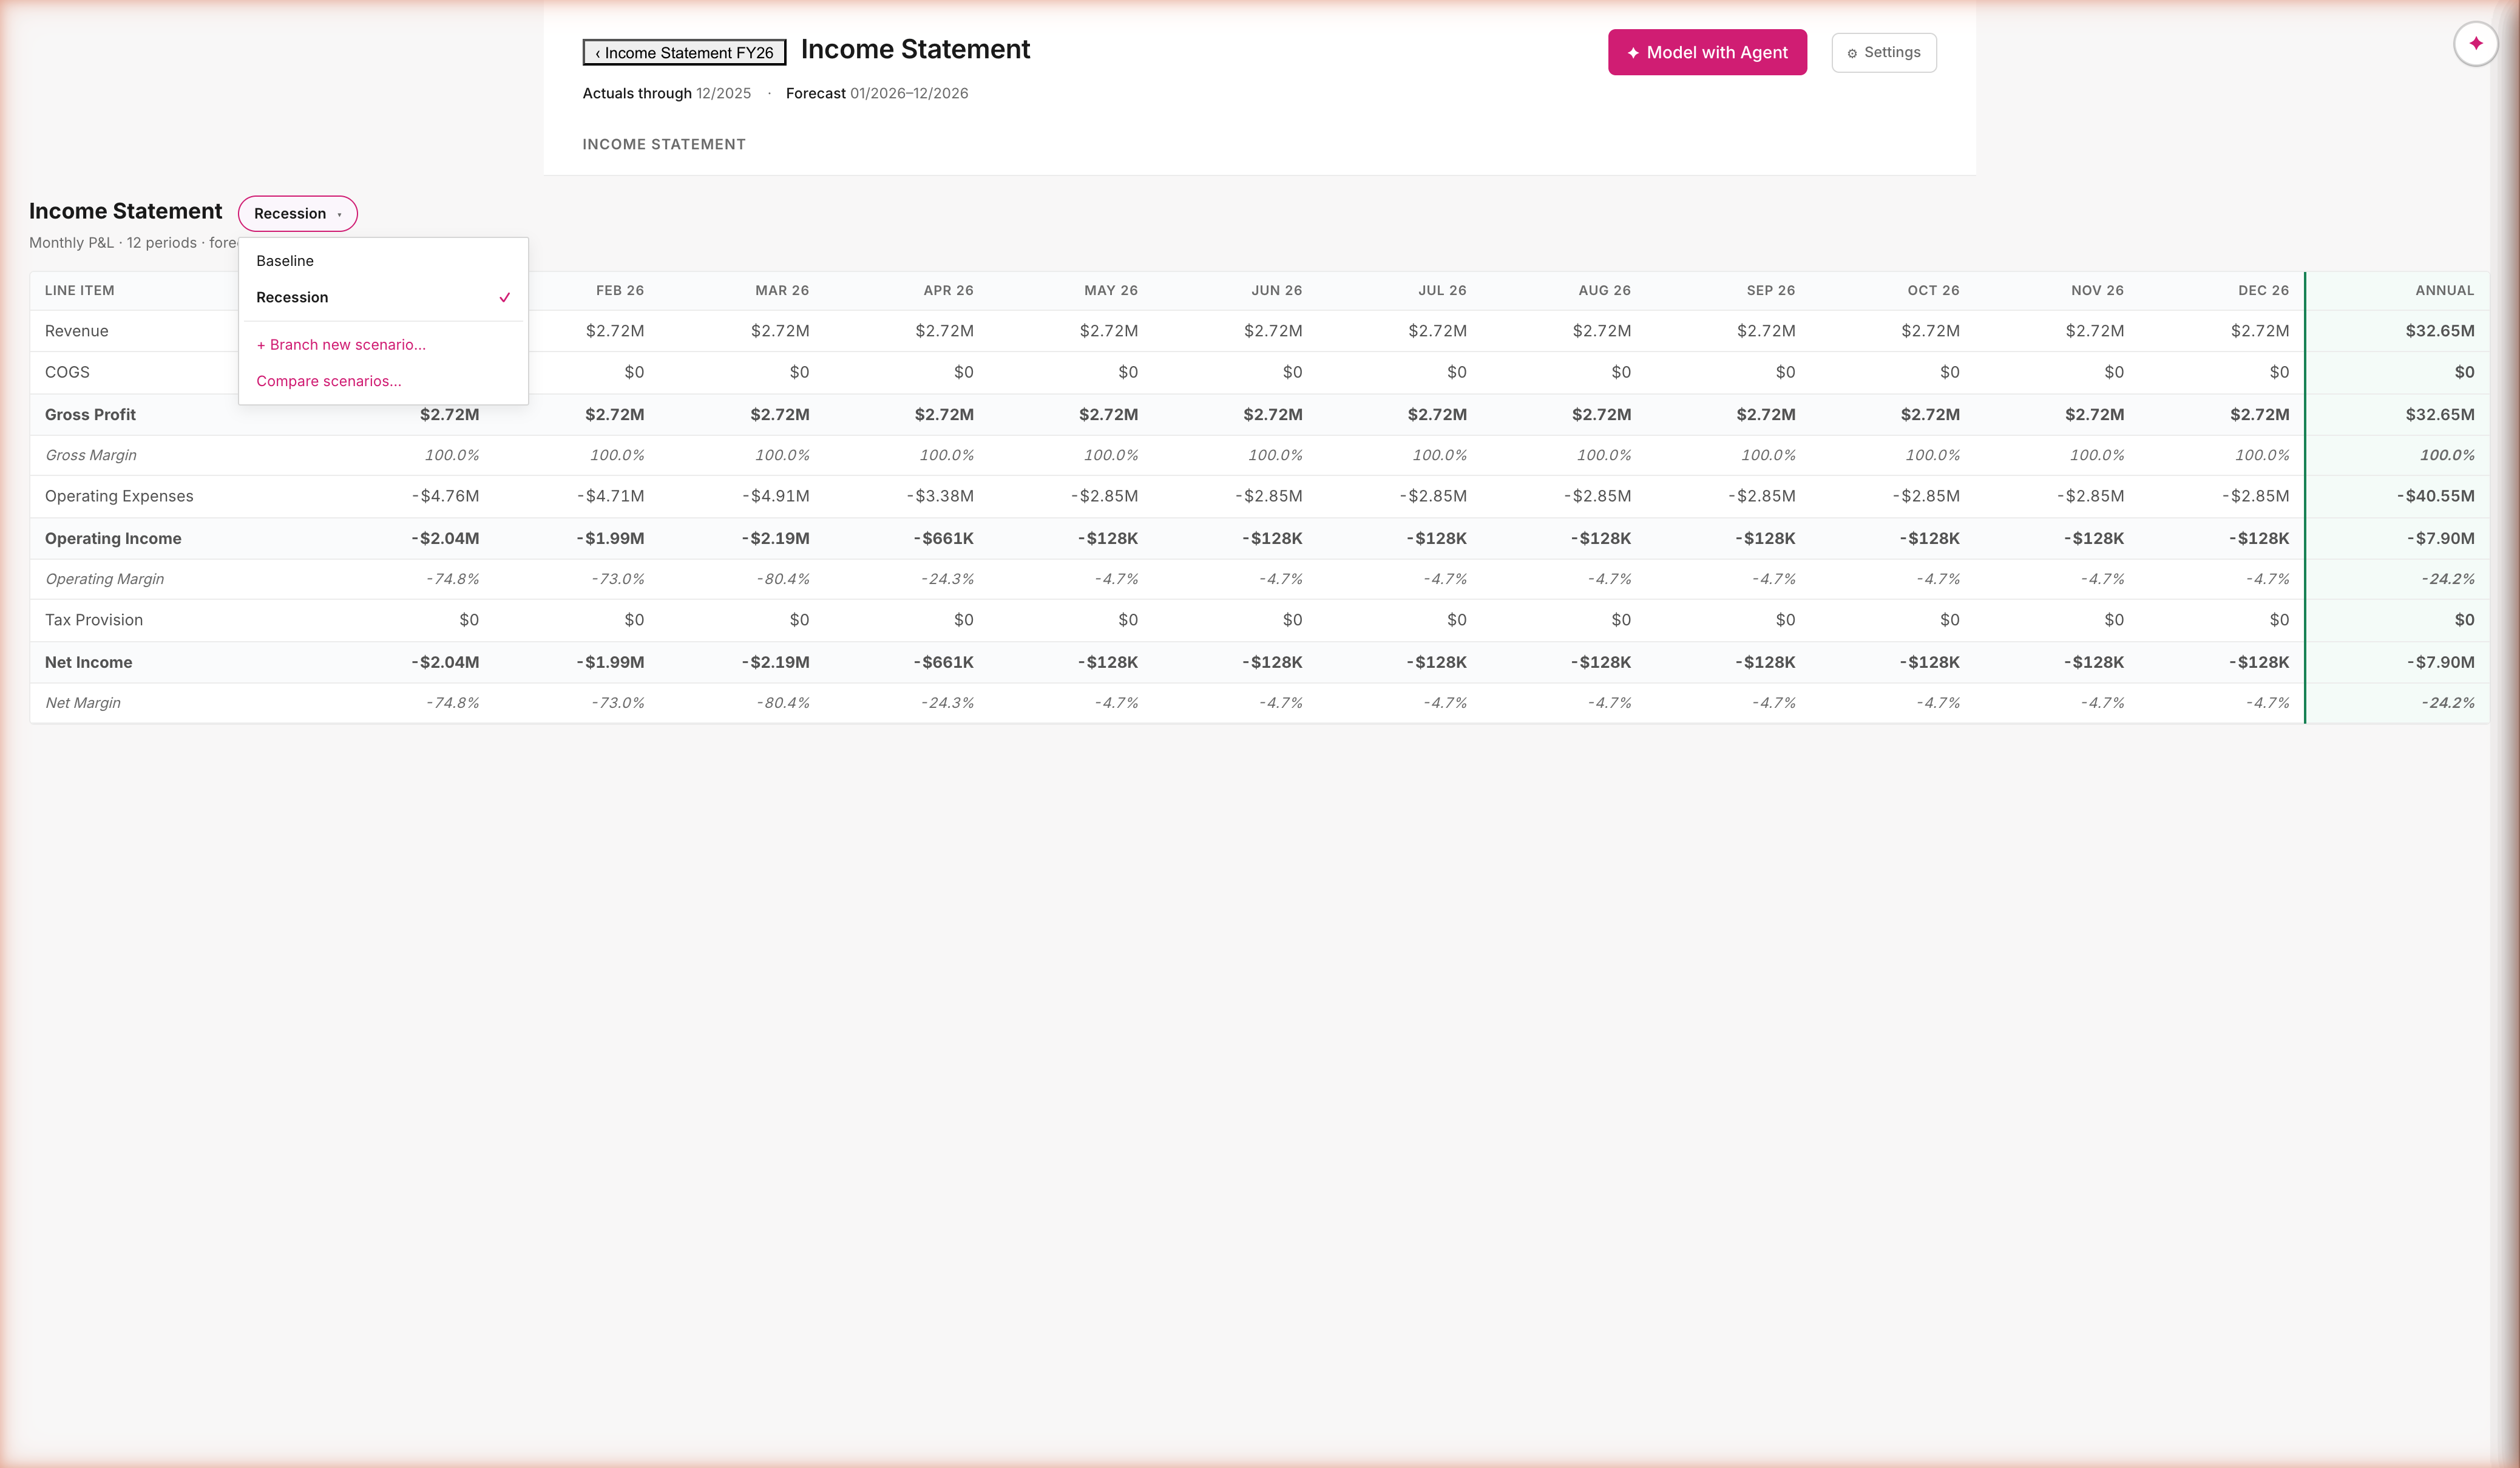
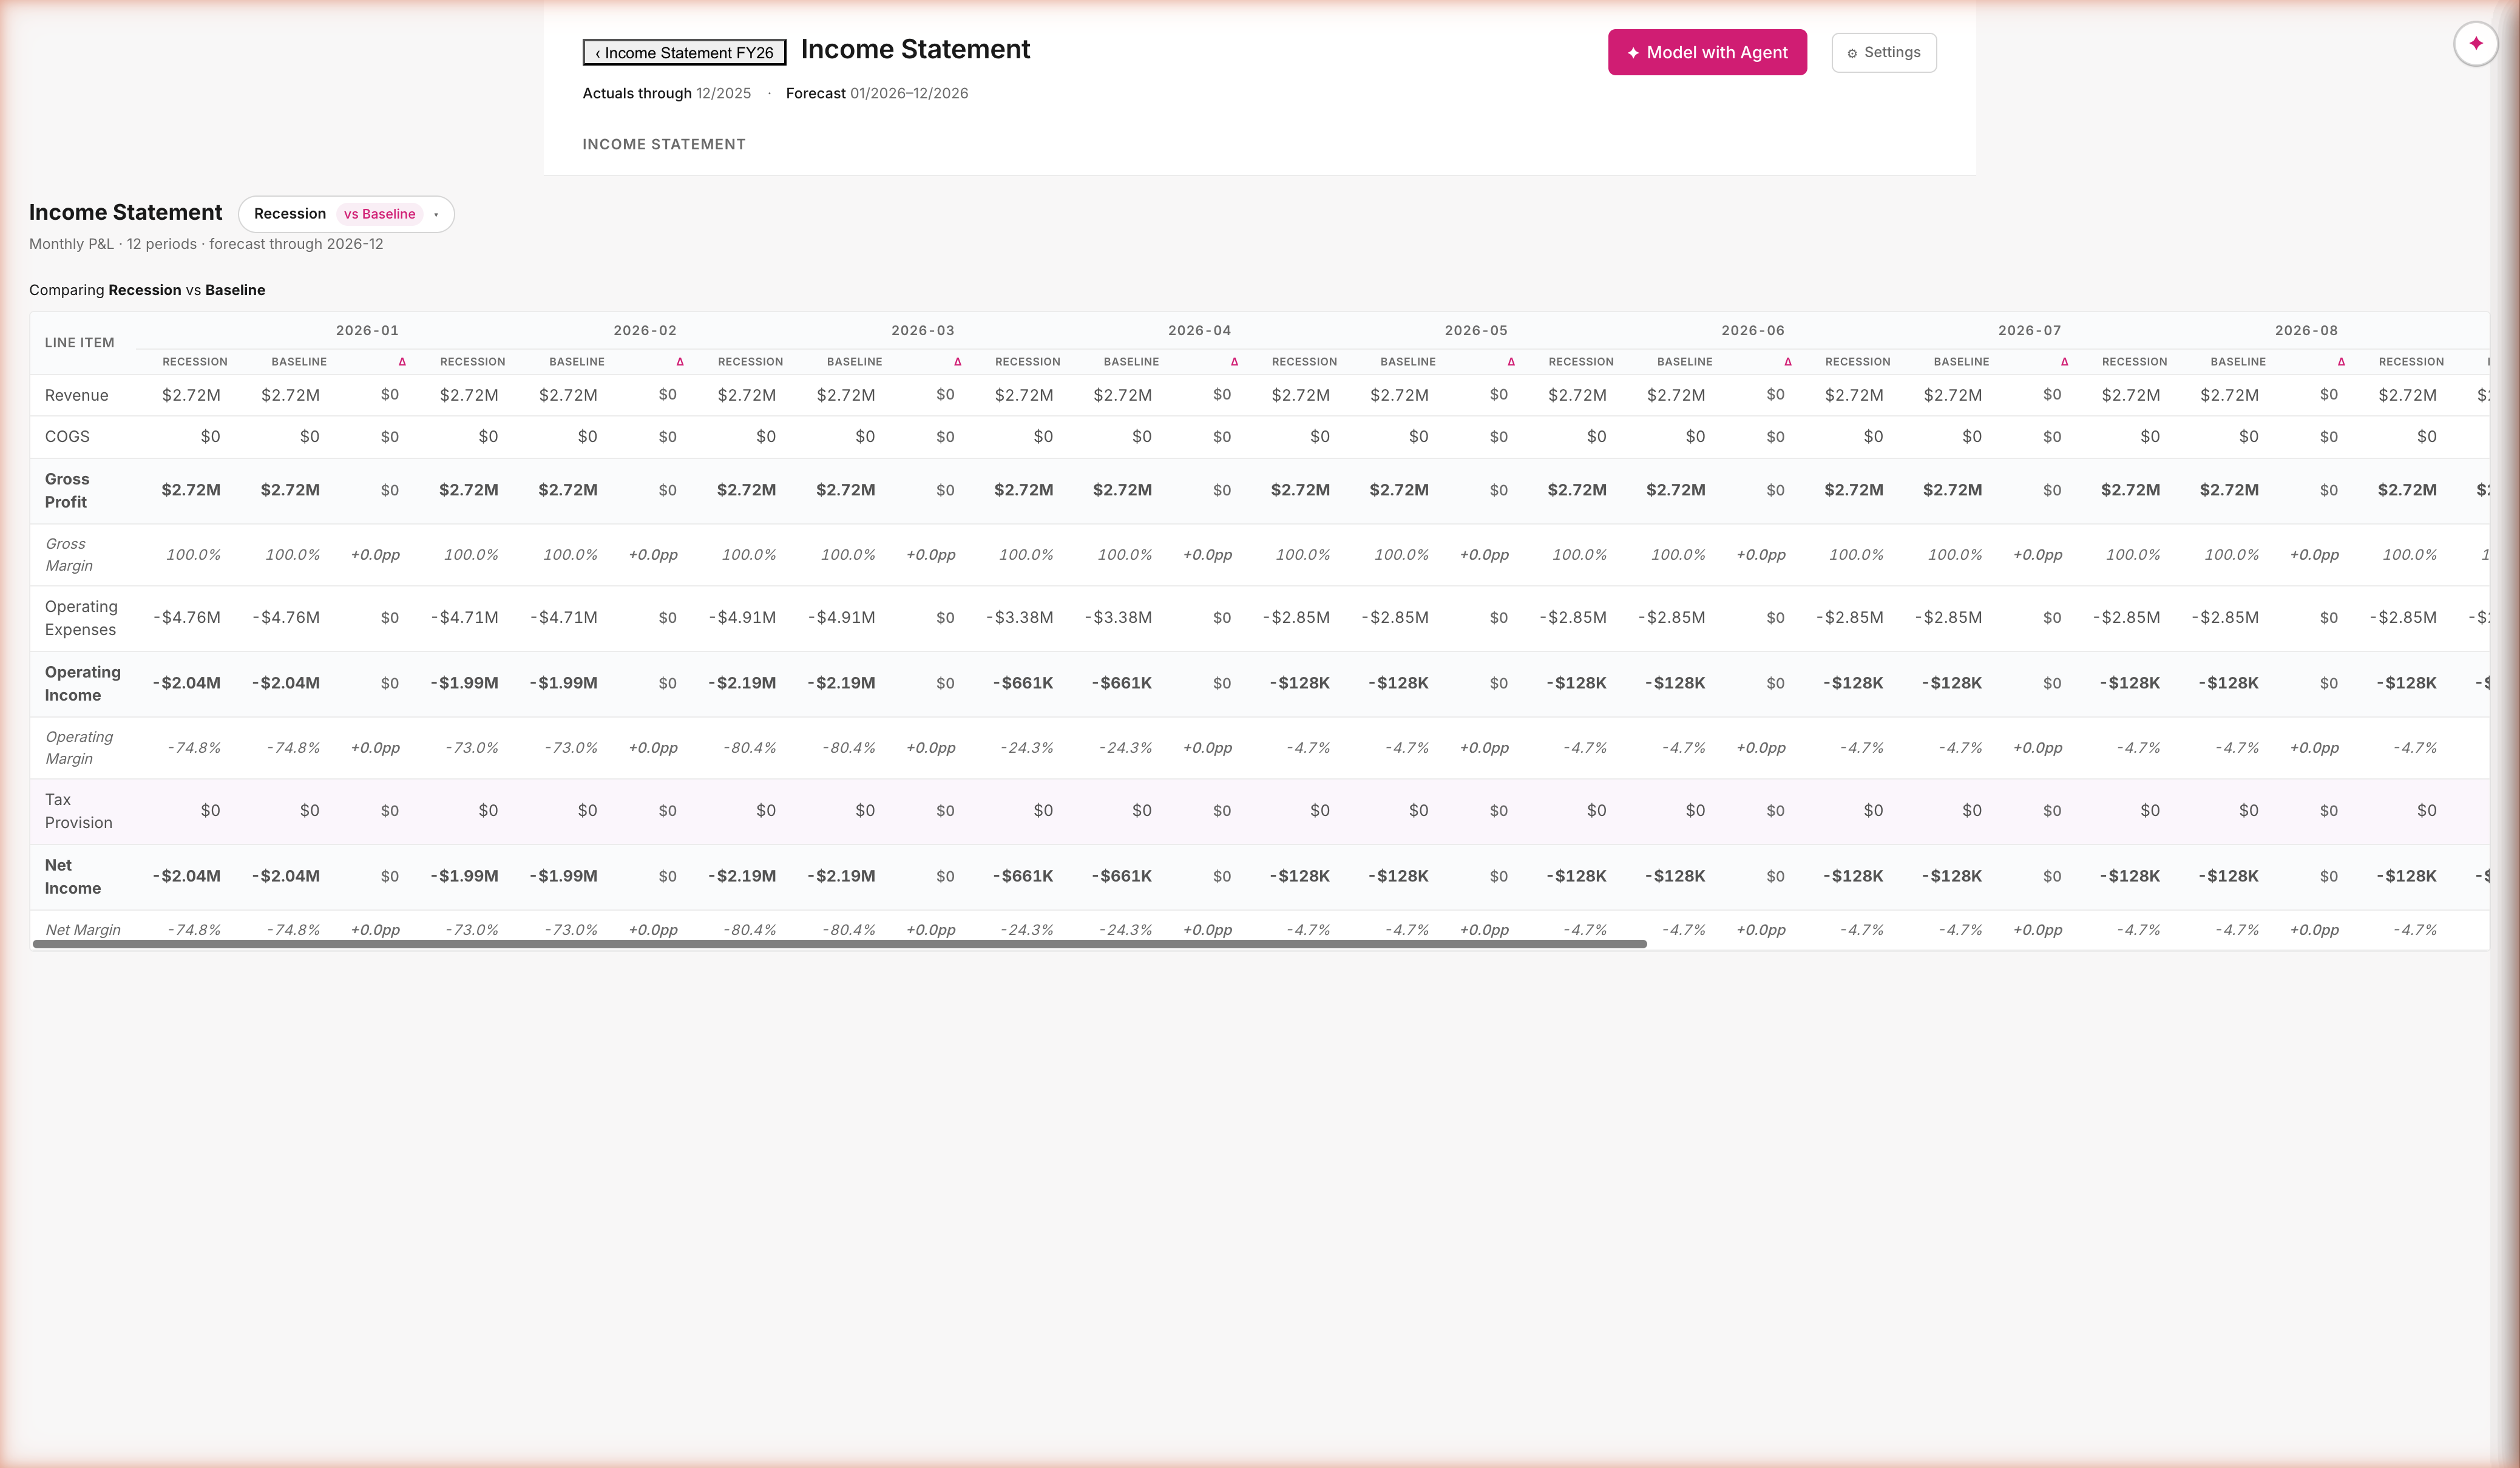
Scenarios diverge. Deltas surface.
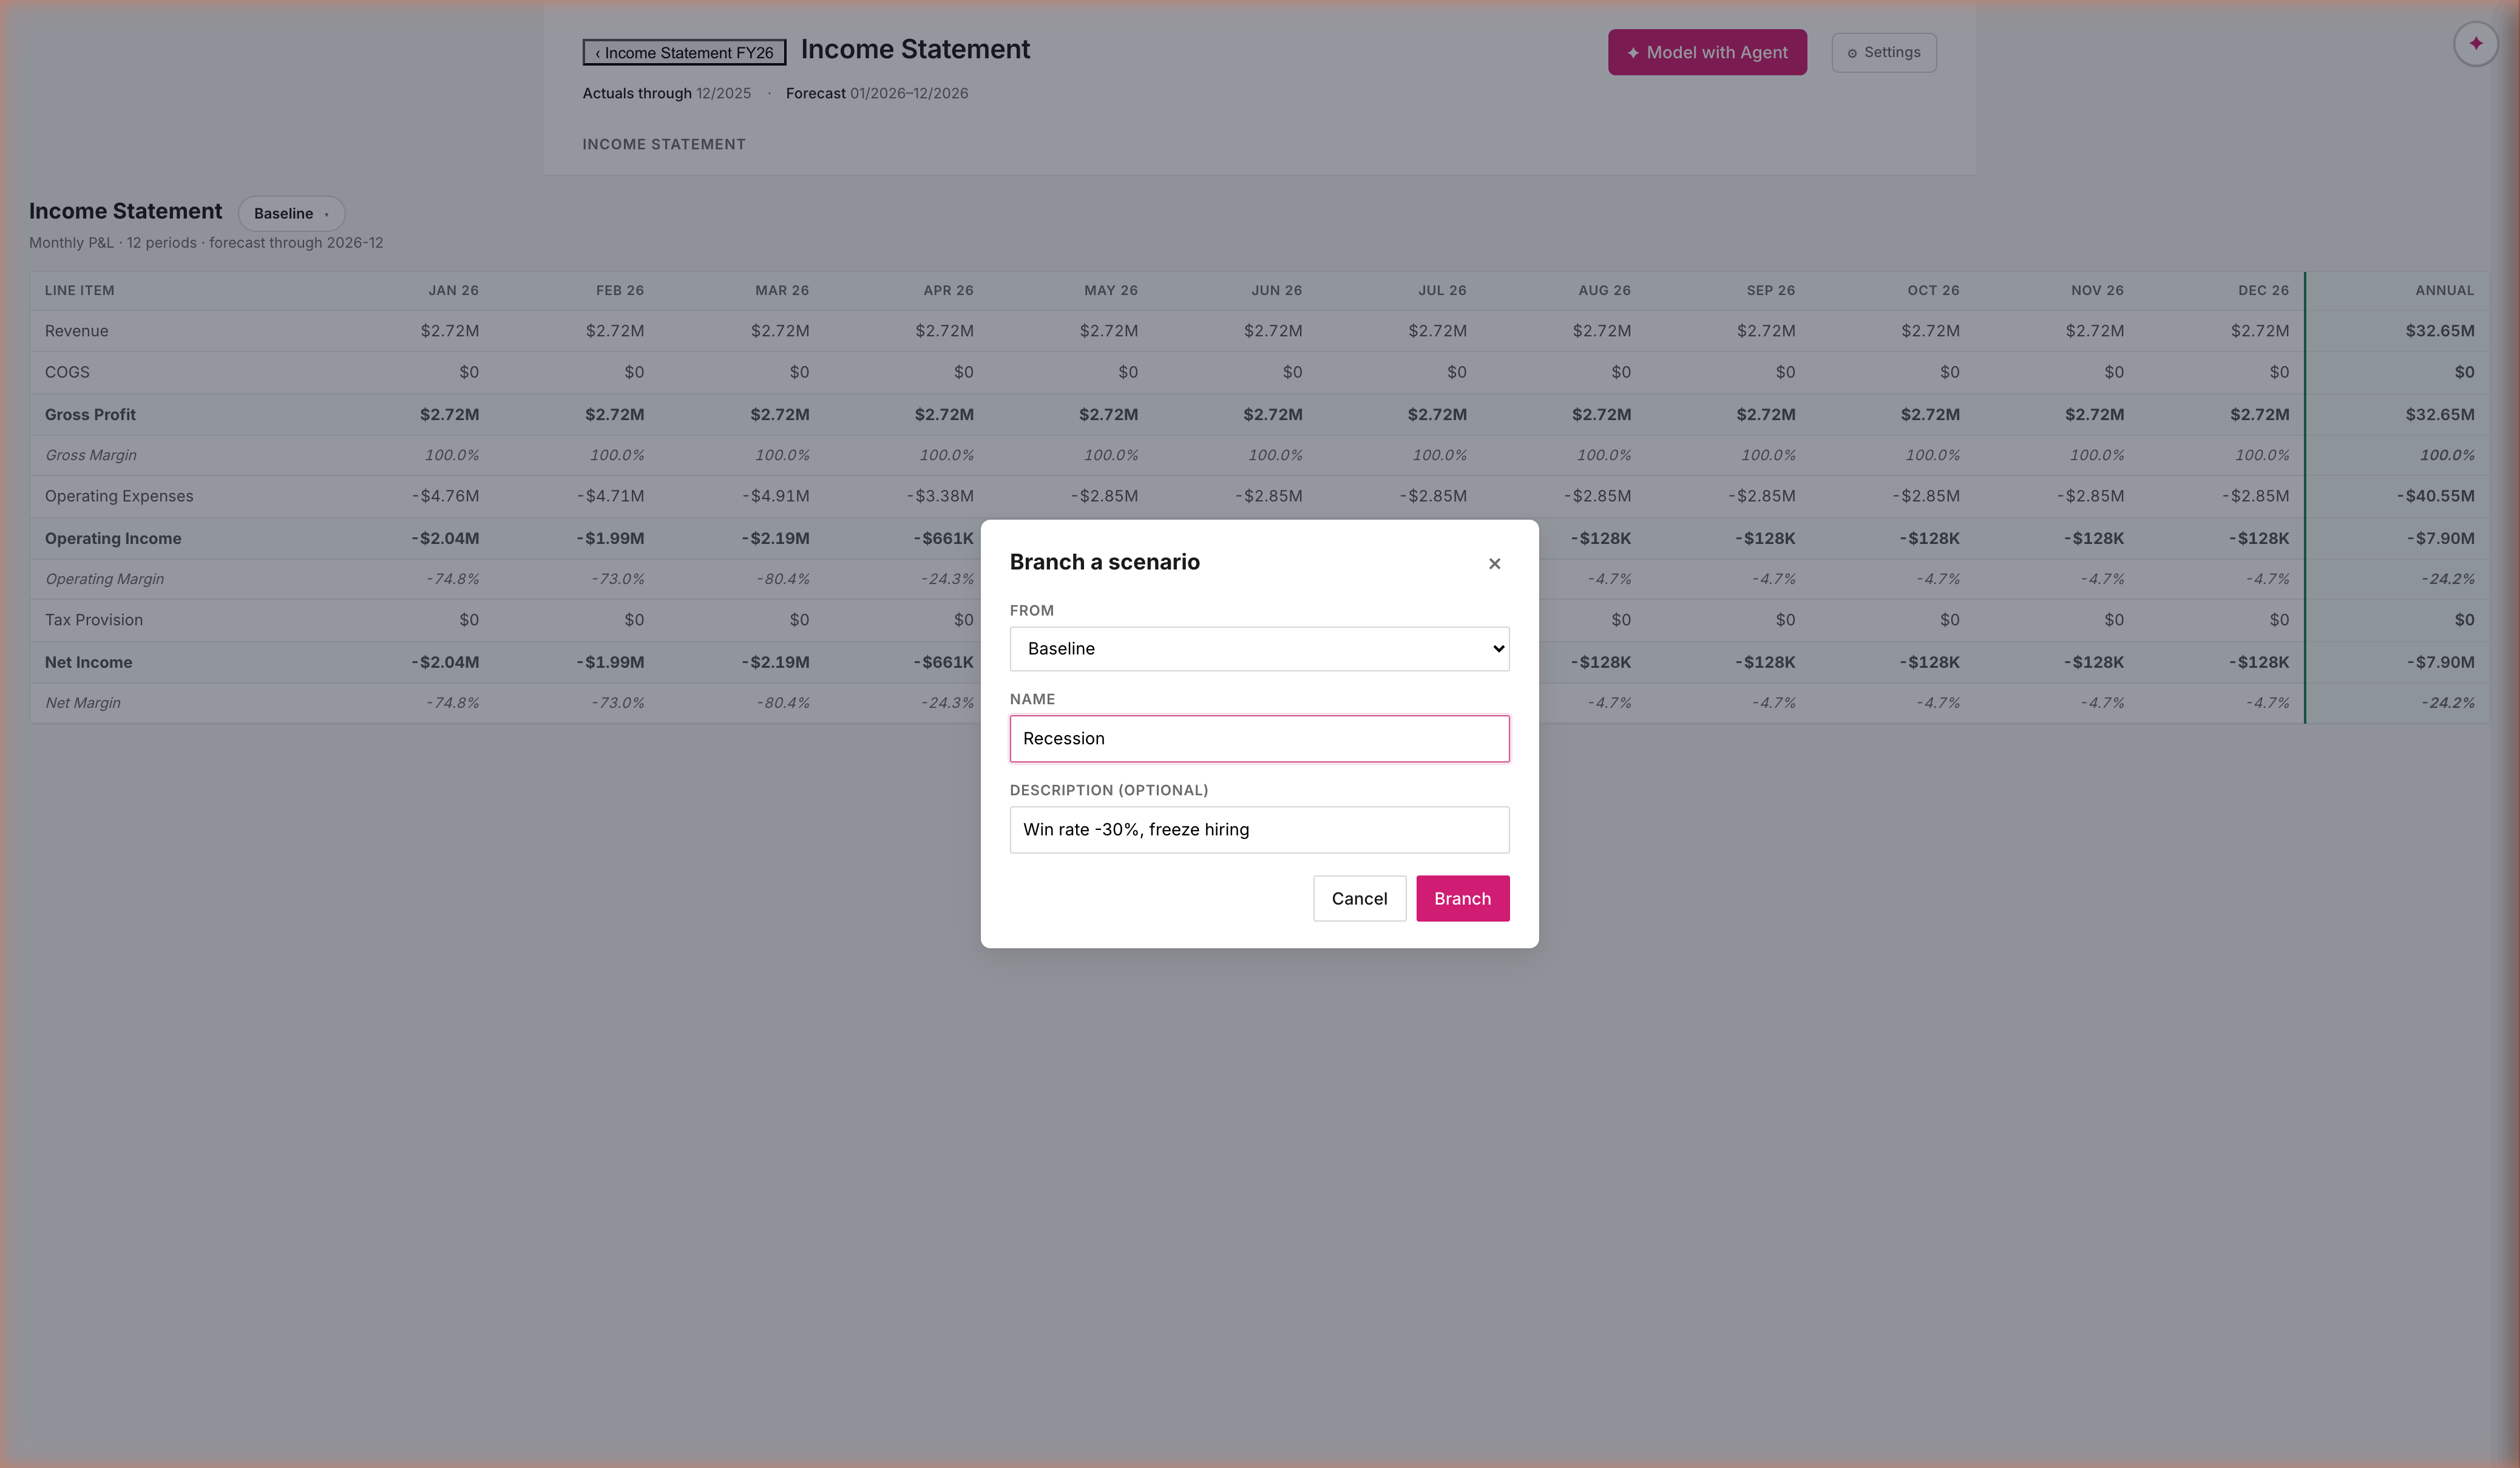
Branch from any scenario; override any assumption; compare anywhere
Branches are stored as delta maps, not full copies. Recession = Baseline + { win_rate: 0.18 → 0.10 }. Every cell is recomputed on demand against the active scenario. Compare view splits each period column into scenario · scenario · Δ — the diff is computed, not authored.
Post-demo · post-Efi alignment · PR19
Top Line isn't a component — it's a Workspace.
May 6 review with Efi · architectural reframe
Per Efi: components are differentiated by what they pre-populate from. HC from roster. IS / BS from the GL. Top Line pre-populates from… nothing — the user starts empty and builds whatever they want (ARR forecast, capacity model, win-rate funnel). That's not a component type. That's the Workspace canvas. The seeded "Topline FY26" is now ARR FY26 — a model built on a Workspace. Cash Flow Statement is a derived report, not a component.
What we shipped
The stack behind the demo
Audit & trust
- Provenance everywhere — every assumption cites IRS / SHRM / Vanguard / Carta / Bessemer; every metric cites its formula source
- Deterministic engine — same prompt + same data = same model · every cell is computed by code, not estimated by AI
- Click-anywhere drill-down — open any object, see its values, dependencies, coverage gaps, and where it's used
Plan-first interaction
- Structured proposal before any mutation — user reviews a card with components, dimensions, inputs, assumptions, metrics
- Modify with × buttons — drop any row, the agent honors it
- One approval, sixteen actions — no per-step "are you sure?" popups
Real data, not mocks
- Three connectors — HiBob (148 employees · 5 currencies · 4 departments), QuickBooks (24 months of GL · 27.6K transactions), Salesforce (38 customers · 124 opportunities · $28.8M ARR)
- Multi-currency working end-to-end — local + USD side by side, FX projection live
- Two working components — Headcount + Topline, both wired through the same architecture
Live demo metrics
- Headcount build: 16 actions, ~5 minutes, real HiBob data, modifications honored
- Topline build: 12 actions, real Salesforce data, $14.3M revenue forecast
- 235 tests passing. Zero hallucinated content. Zero ignored modifications. Zero phantom assumptions.
All shipped, all live, all tested
A working prototype against the real Anthropic SDK. Two components, three connectors, full plan-first / inspect / edit / author surface. Demonstrates everything in this deck — at any time, in five minutes.
The insight
The catalog is the integration
A single catalog holds the entire universe of things Bob Finance understands — every assumption, every metric, every formula, every benchmark source. The agent doesn't guess. It looks up by reference. Every assumption in the Library cites its source; every metric cites its formula; every report routes through it.
That one architectural decision unlocks everything:
- Plan-first works because the proposal is a structured list of named entries, not free-form text the agent has to interpret.
- Modifications propagate because the plan IS the spec. Drop a row → that row never gets built.
- Connectors are first-class — the agent gets a structured note of what data exists, same authoritative pattern as the approved plan.
- Audit is free — every number on every screen traces back to a named catalog entry with a benchmark citation.
- Reports compose — generating an FX exposure summary or a runway analysis is a catalog lookup, not a bespoke report.
- Customer extension scales — production customers add their own catalog entries (assumptions, metrics) the same way HiBob lets customers extend their HRIS field schema.
Why this scales
Mosaic v1 integrated with Workday, NetSuite, Salesforce, and HiBob through bespoke connector code per source — every new integration was an engineering project. Bob Finance v2 makes the catalog the integration layer — connectors map their data into the same catalog the agent reads from. Adding a new tax burden, a new currency, or a new revenue type is a catalog edit, not a code change.
Status
What this is. What's next.
What works today
- Two complete demos — Headcount cost forecast (148 employees) and Topline ARR forecast (38 customers, 3 segments)
- Multi-currency end-to-end — local and USD side by side, FX projection live, 5 currencies
- Inspect / edit / author surfaces — full audit drawer for any object, full-page builder for substantial work
- Real benchmark data — IRS, SHRM, Vanguard, Carta, Bessemer all cited and visible
- 235 tests passing, TypeScript clean, every screenshot in this deck captured from a working session
Shipped since the demo (PR15-PR19)
- Plan-first enforcement (PR15) — Builder/Analyst can't run until the user signs off on the Plan card
- Income Statement component (PR16) — GL accounts pre-populate; same pattern as Headcount
- Cross-component drivers (PR17) — IS.Revenue can pull from Workspace.ARR; "Fed by" badge on the metric
- Real scenarios (PR18) — branch any scenario as a delta map; override one assumption; side-by-side compare
- Workspace + post-Efi reframe (PR19) — Top Line is a Workspace, not a component; Topline FY26 → ARR FY26
Up next
- Balance Sheet (PR20) · Component picker on new model (PR22) · Global vs Local assumptions (PR23)
- Snapshot metric → static assumption (PR24) · Catalog learns user-built relationships (PR27)
Where we are
The flow is steerable, grounded, and reproducible. Anyone running the same prompt against the same data gets the same model — every time. That's the bar for "AI in finance" — not "let me ask the bot what it thinks," but "the model behaves like a calculator the agent operates." We cleared the bar.
Demo nailed
Real data. Real prompt.
Real plan.
One sentence — "forecast total employee cost for 2026 for existing employees" — produced a structured plan grounded in 148 real HiBob employees, 5 currencies, and 6 country-specific assumptions. The user steered before any state changed. The Builder ran 16 actions in sequence with zero re-prompts. The Analyst closed citing real benchmarks. End to end. Real data. Real plan. No black boxes.
~145k
Tokens · ~5-min build
The breakthrough isn't "we got AI to build a financial model."
The breakthrough is "we got AI to build one deterministically, with audit, in a way that scales as a platform."
![Builder mid-flight: 2026 ARR Forecast model with 5 Baseline component planners (HC, TL, IS, BS, WS) all pending; chat drawer shows the [APPROVED PLAN] system note (full plan JSON visible) followed by 'Building from approved plan: 2 dimensions, 2 inputs, 4 assumptions, 5 metrics.' and tool calls flowing (createModel, addDimension)](screenshots/30-pathB-builder.png)