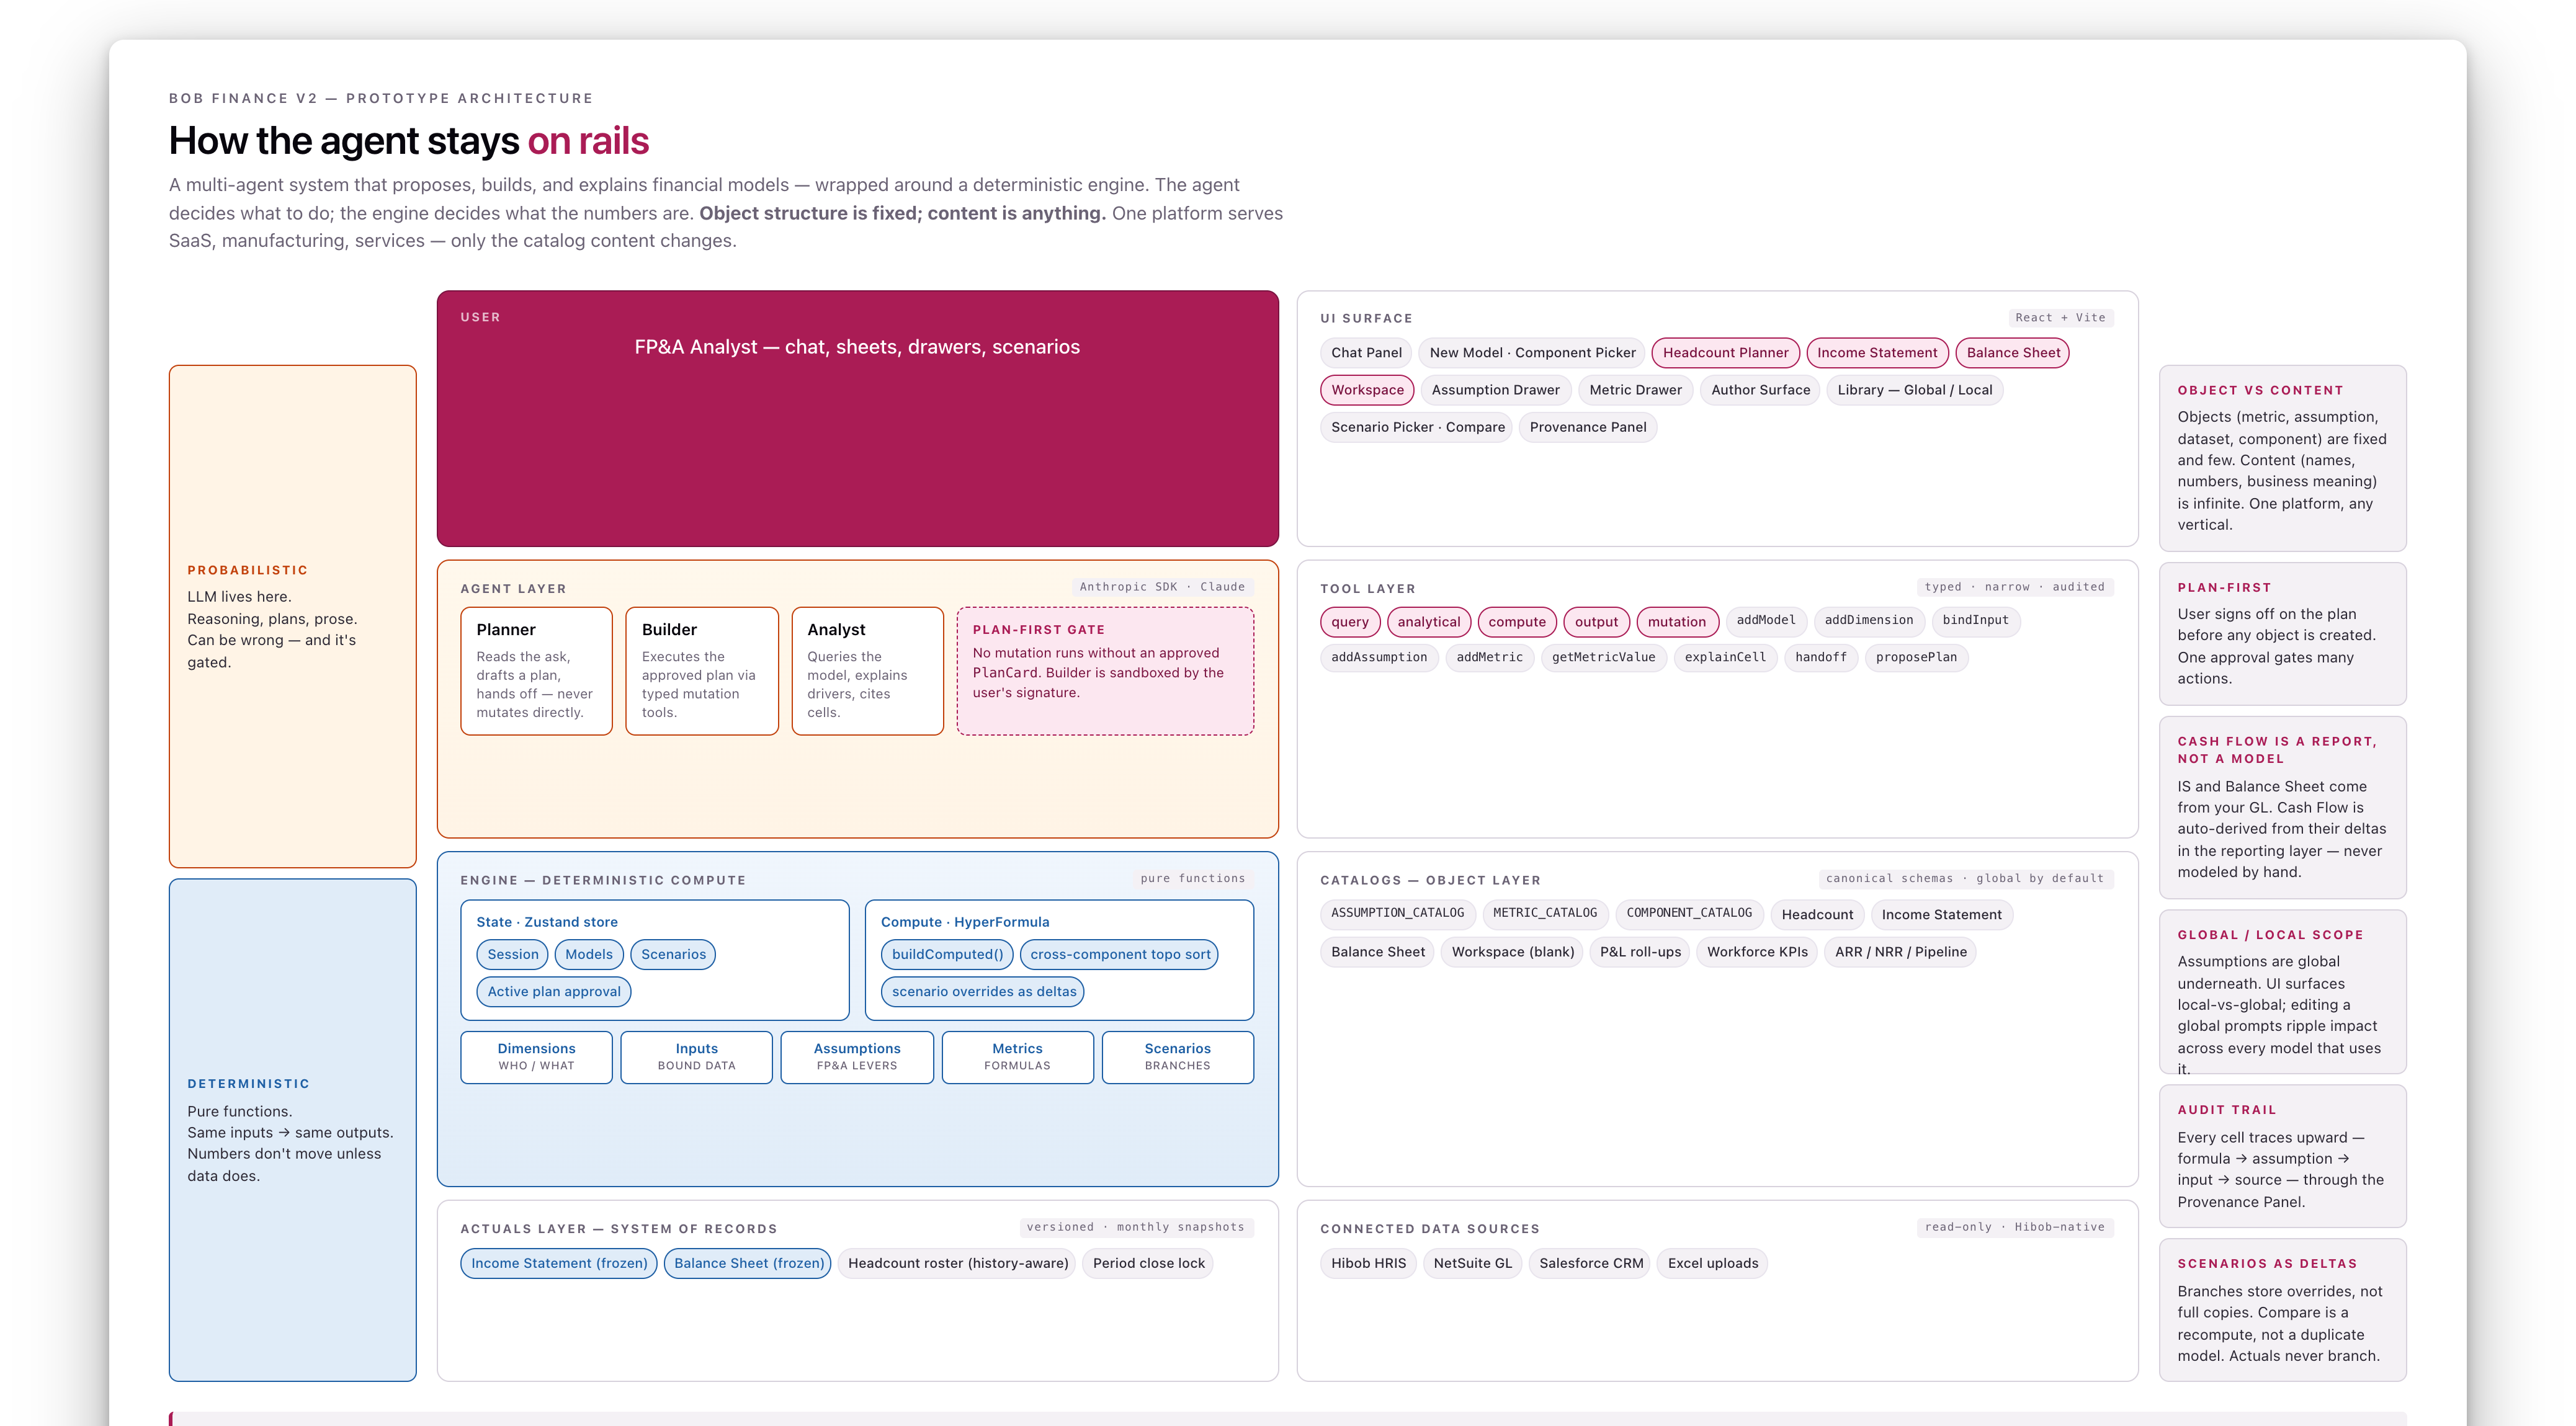
The 2026 budget,
built in twenty-five minutes.
A live walk-through of an FP&A leader using Bob Finance v2 to forecast existing comp, add new hires, layer in a bonus pool, build the P&L, spin up a recession scenario, close Q1, and ship the board report — against real HiBob, QuickBooks, and Salesforce data.
Every screen is the actual product. Every number traces to a real source. No mockups, no fixtures.
bobfinance · fy26-budget-deck01 / 22
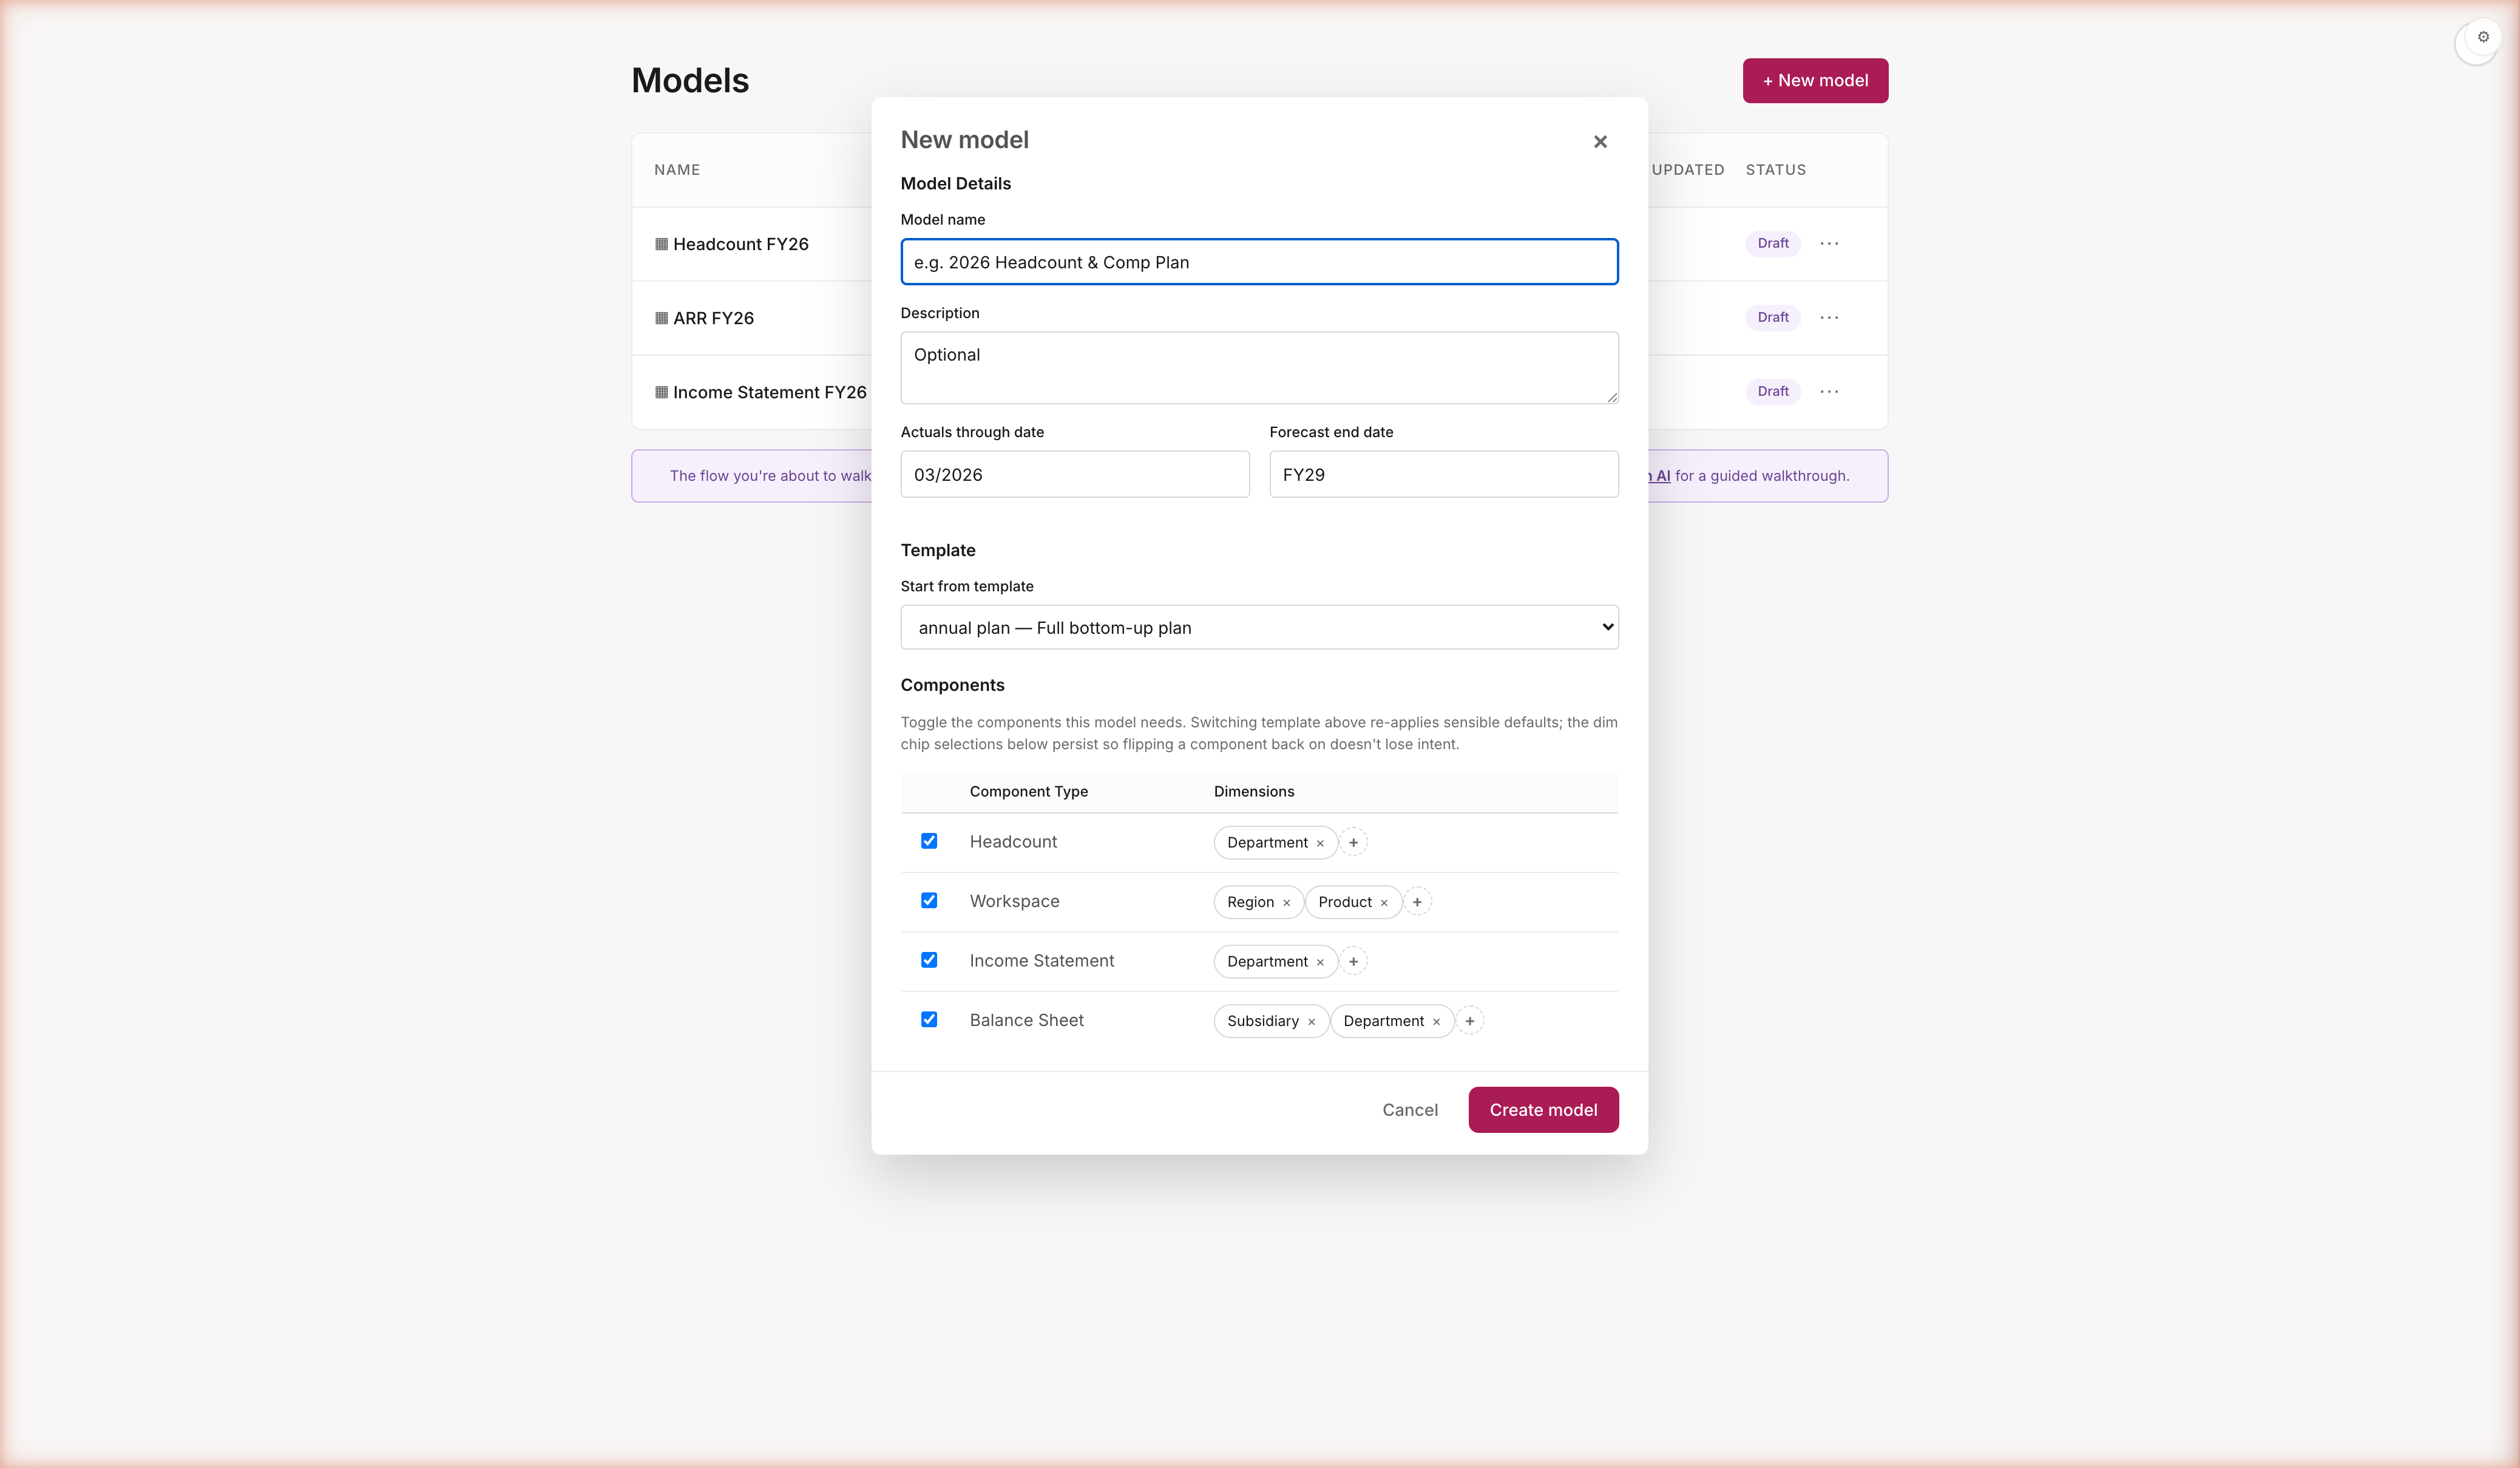
 STEP 0 · CREATE THE MODEL
Modular components. Pick and choose — build the full model, or just HC.
Same creation flow for every customer shape. Toggle the components you need. Set per-component dimensions (Department, Subsidiary, Location, Region, Product). Templates set sensible defaults; you override before clicking Create.
You choose the shape — HC only, full three-statement, or anything in between. No template lock-in, no setup wizard you can't escape. Toggle the components your business actually plans against. Set the dims you'll slice by. Click Create. The model meets you where you are — not where the tool wishes you were.
bobfinance · fy26-budget-deck03 / 22
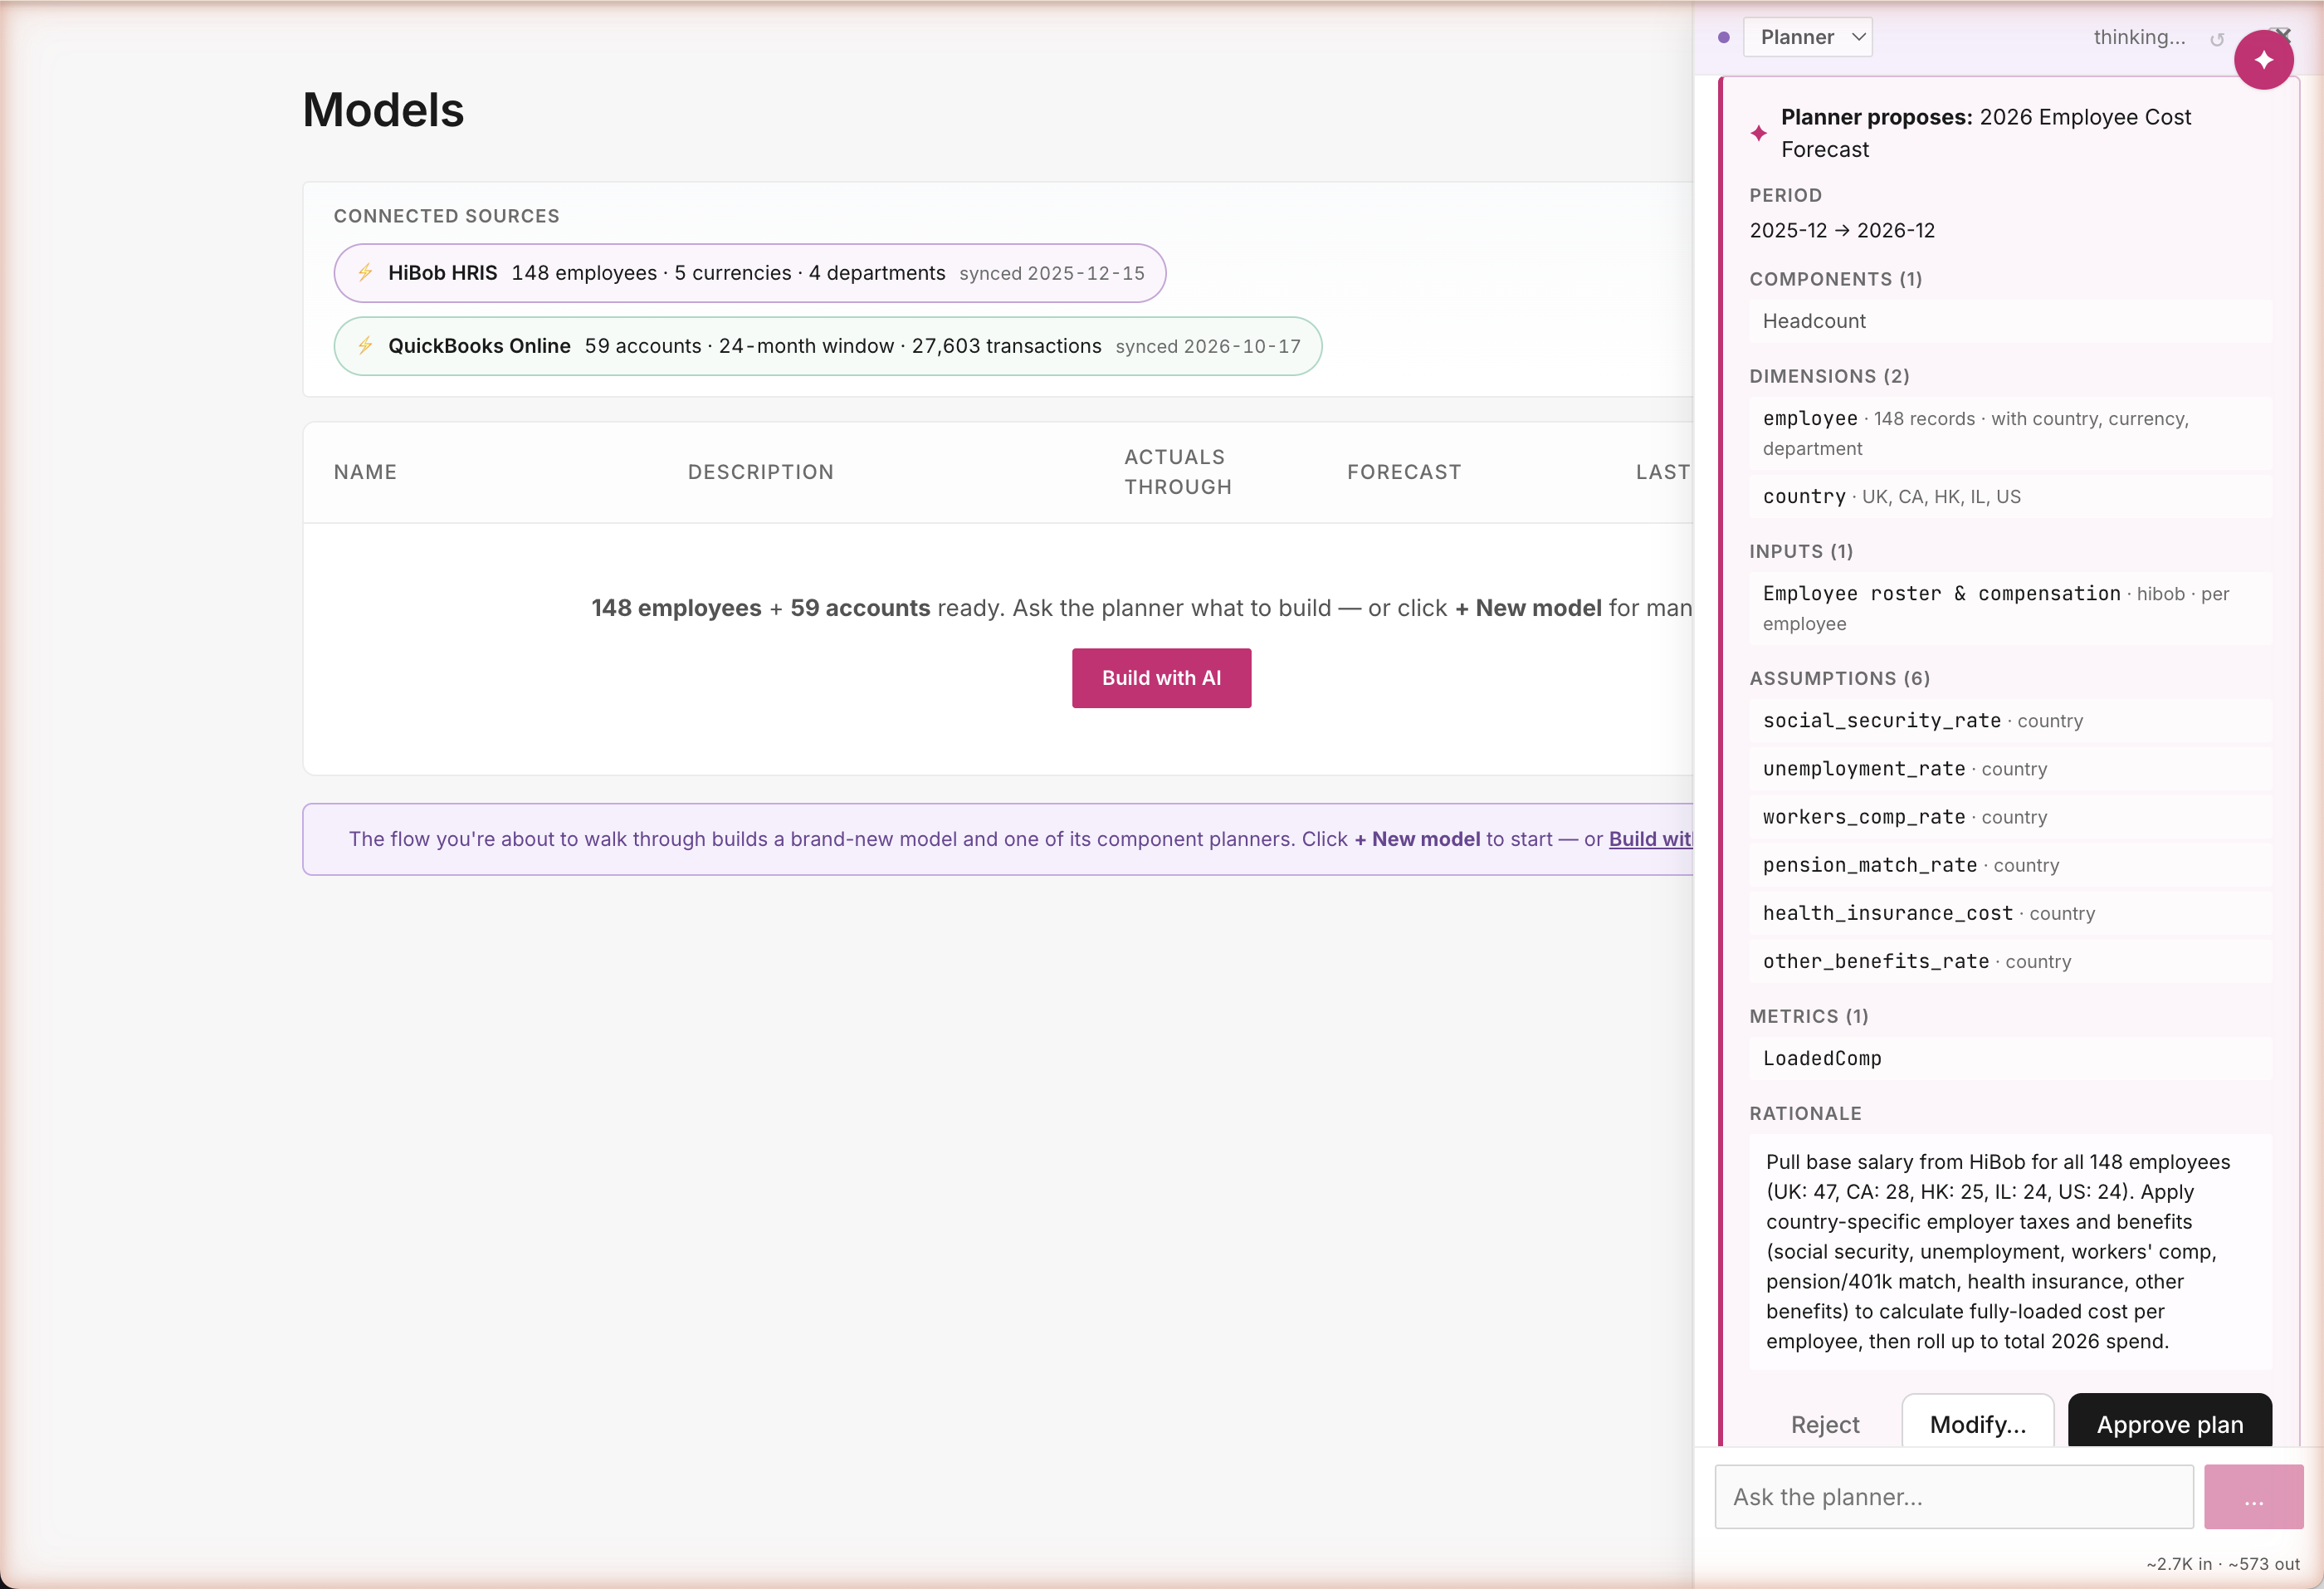
STEP 0 · DELEGATE TO THE AGENT
"Forecast 2026 comp." The agent shows you a plan first; you approve before anything actually changes.
One sentence in chat. The Planner reads your HiBob roster, drafts a structured plan with every input · assumption · metric named and cited. You modify with × buttons or accept as-is.
Don't want to wire 6 assumptions and 2 metrics by hand? Hand it to the agent. One sentence in chat. The Planner reads your roster, drafts a structured proposal, cites every source. Nothing changes until you click Approve — and you can × out anything you don't want before you do. Agent moves fast; the plan card keeps you in control.
bobfinance · fy26-budget-deck04 / 22
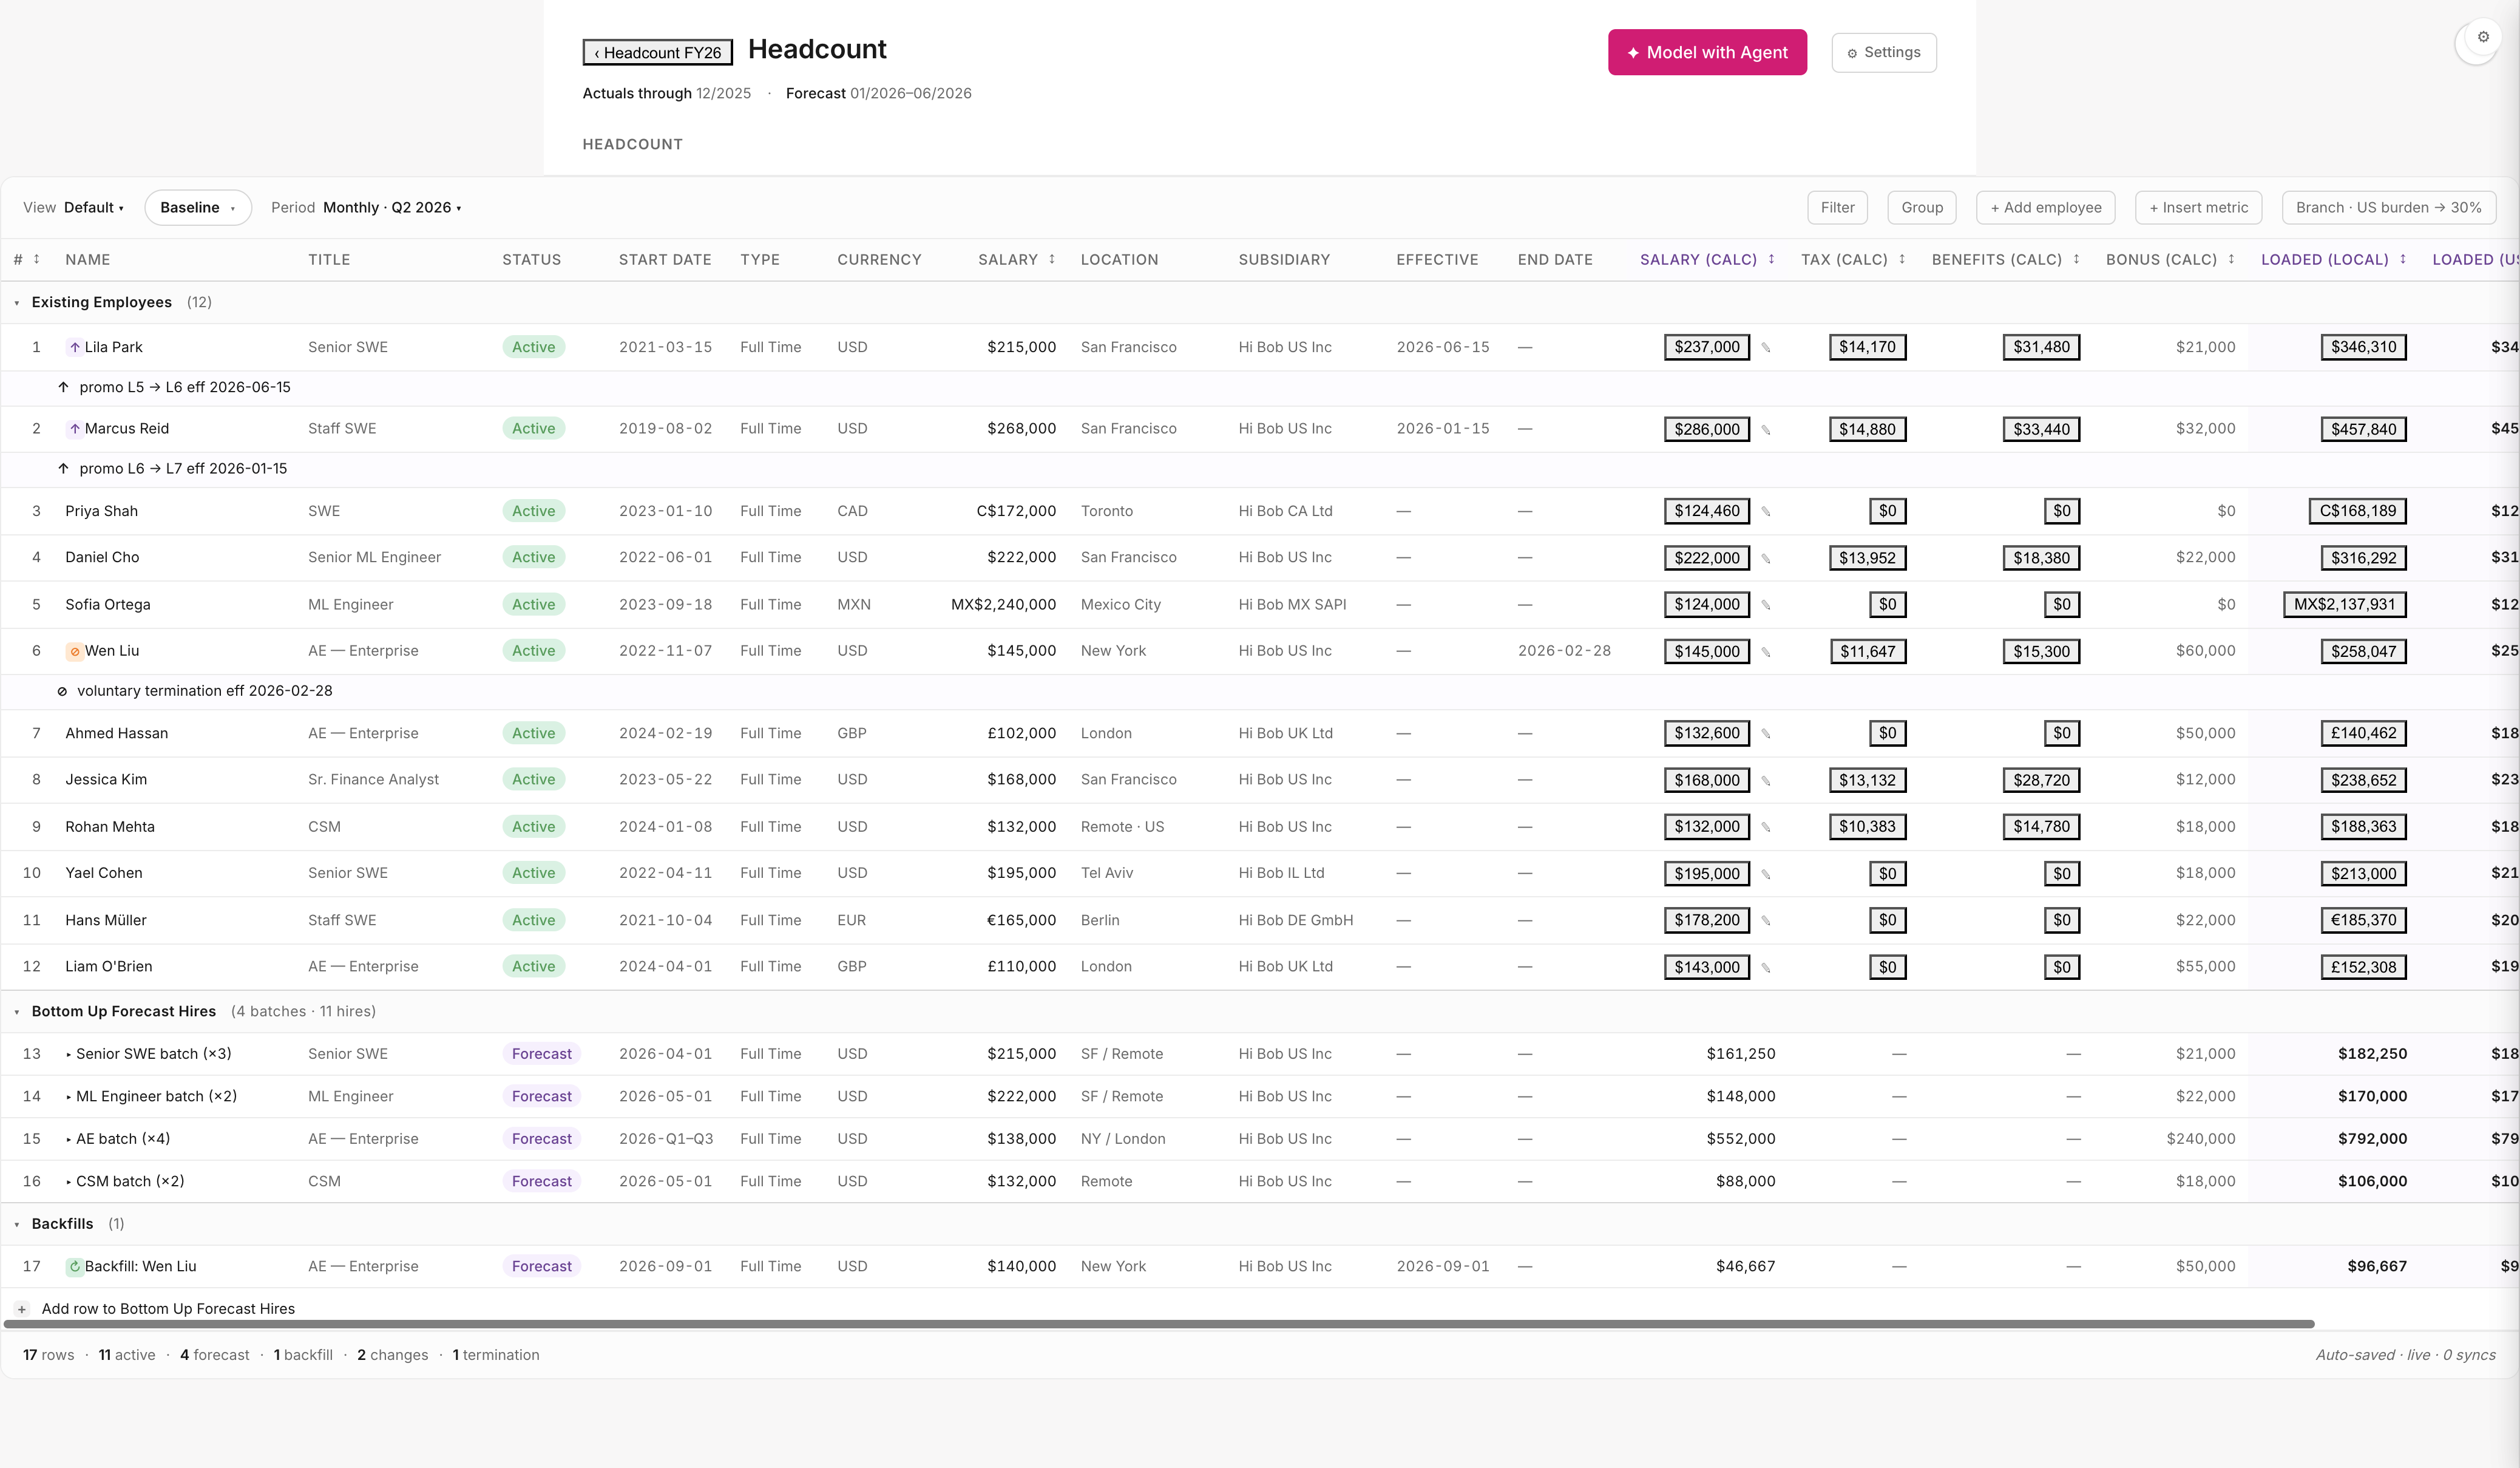
STEP 1 · BASELINE
What does our existing team cost in 2026?
Open Headcount → see 148 real employees · 5 currencies · 6 legal entities · multi-currency loaded comp computed live.
Every FY budget conversation starts here. $22M run-rate across 148 employees, multi-currency, multi-entity — pulled live from HiBob, no exports, no reconciliation. The roster is the source of truth and the model knows it — no mappings to maintain, no stale headcount tab in Excel. You're already further than most teams get on day one.
bobfinance · fy26-budget-deck05 / 22
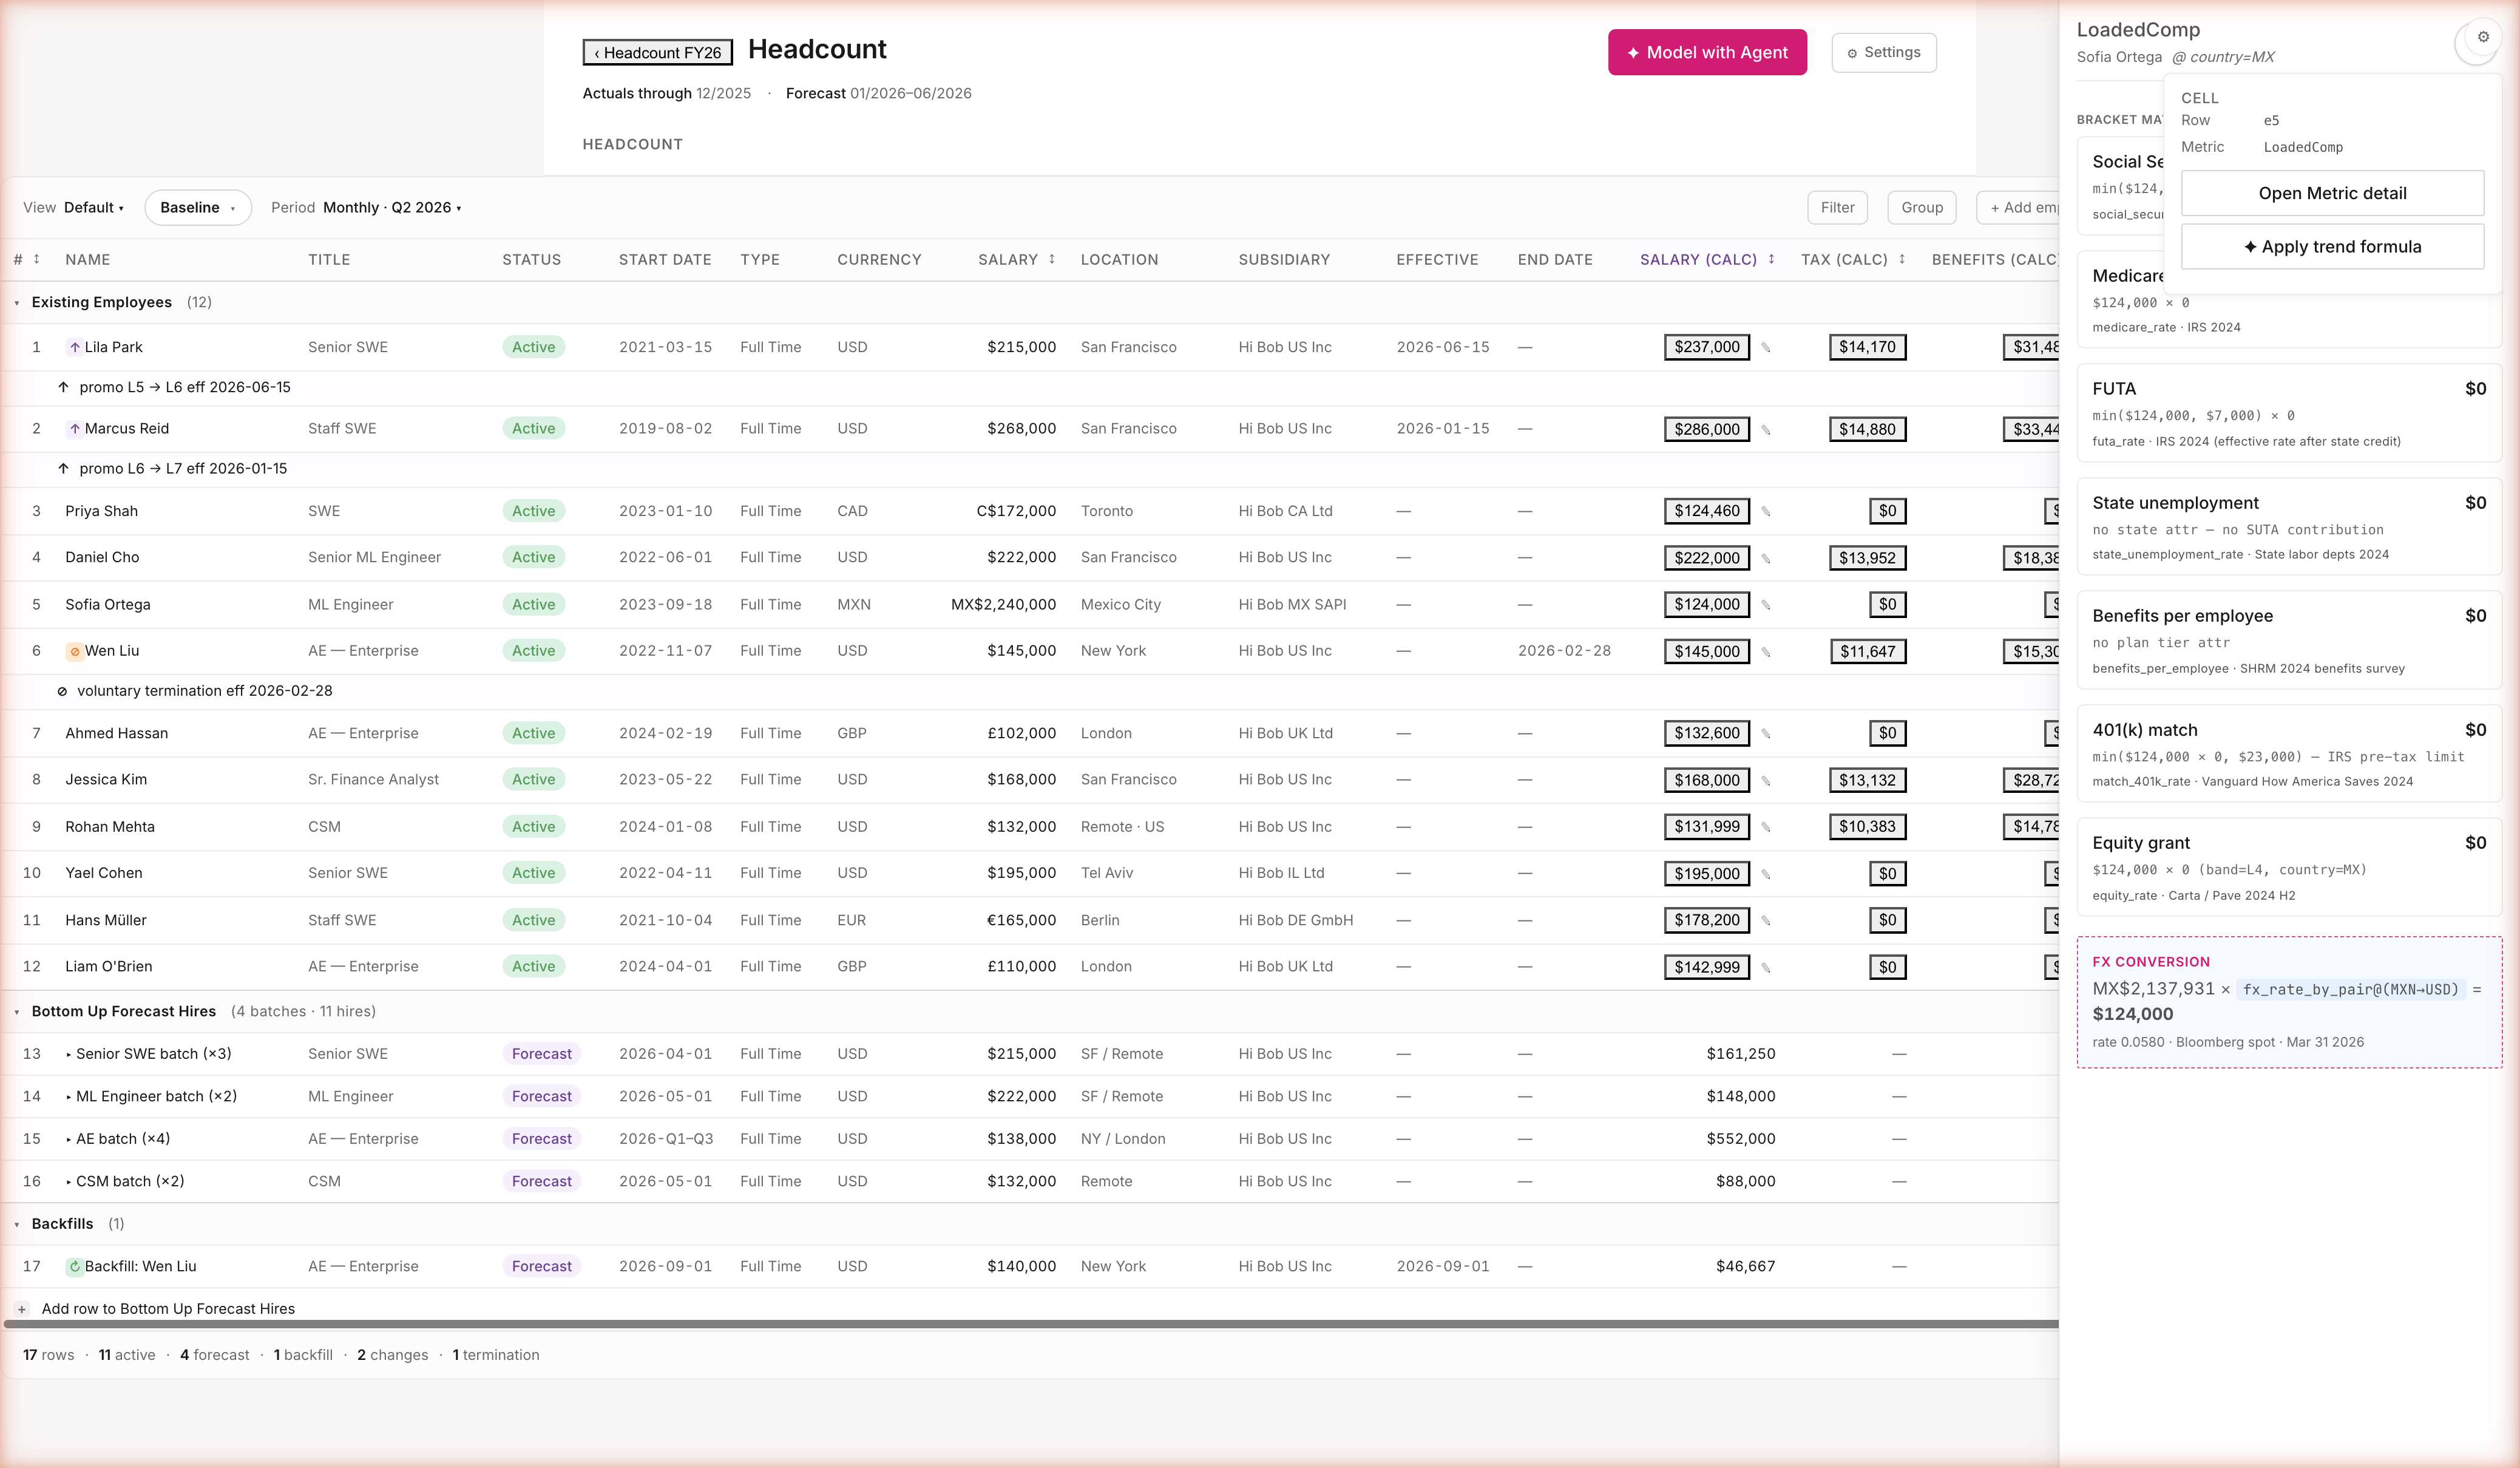
STEP 2 · AUDIT TRAIL
Click any number. See where it came from.
Sofia Ortega's loaded cost in MXN — every tax, benefit, equity vest, and FX conversion shown with its citation.
Click any cell. The math, the inputs, the citations. Sofia's loaded comp shows the bracket-by-bracket build — Social Security · Medicare · FUTA · benefits · equity · FX — each citing IRS · SHRM · Vanguard · Carta/Pave · Bloomberg spot. When the CFO asks "how do we know," the answer is one click, not a half-day reconcile. Audit-ready by construction.
bobfinance · fy26-budget-deck06 / 22
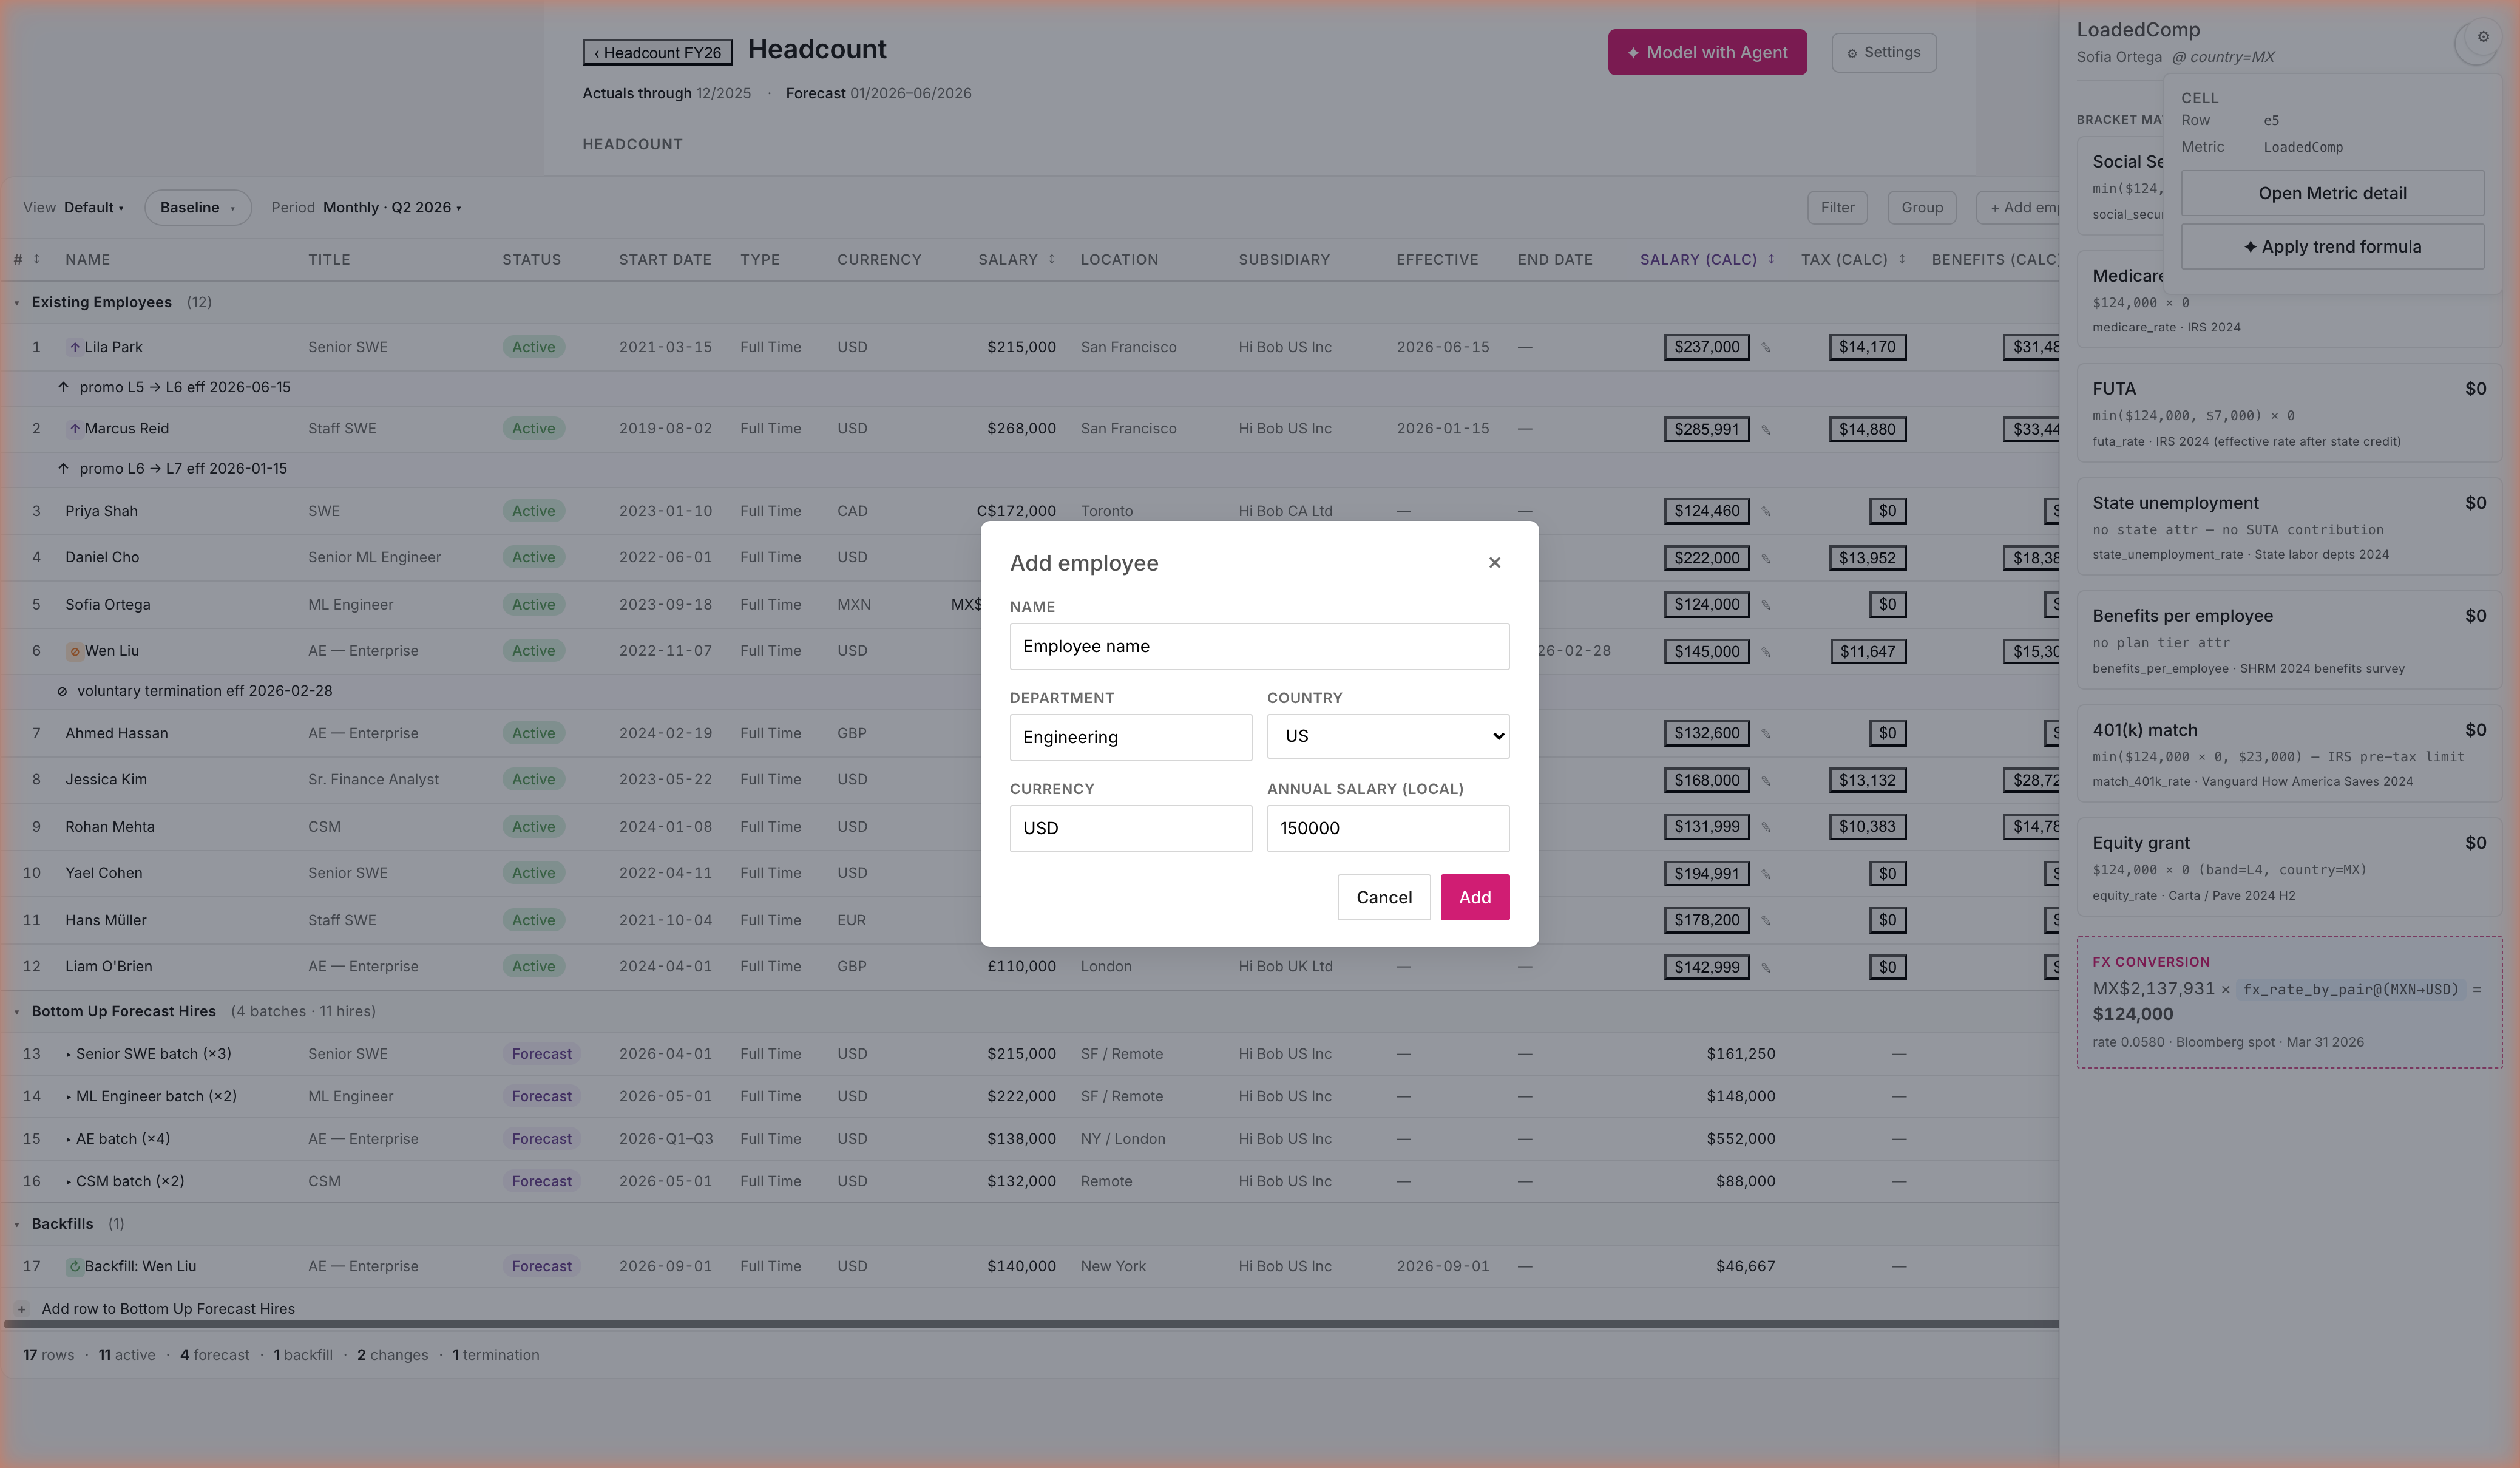
STEP 3 · ADD HIRES (MANUAL)
Add this year's approved hires — click + Add employee.
Workforce planning signed off on 12 hires across the year. Add them yourself in 30 seconds — or ask the agent to do them in one shot.
Sometimes you just want to add the hire yourself. Five fields, one Save — the new row inherits currency from country, FX from the catalog, tax burden from burden_blended_by_country. You type 5 things; the engine wires 12. Manual control without the manual busywork.
bobfinance · fy26-budget-deck07 / 22
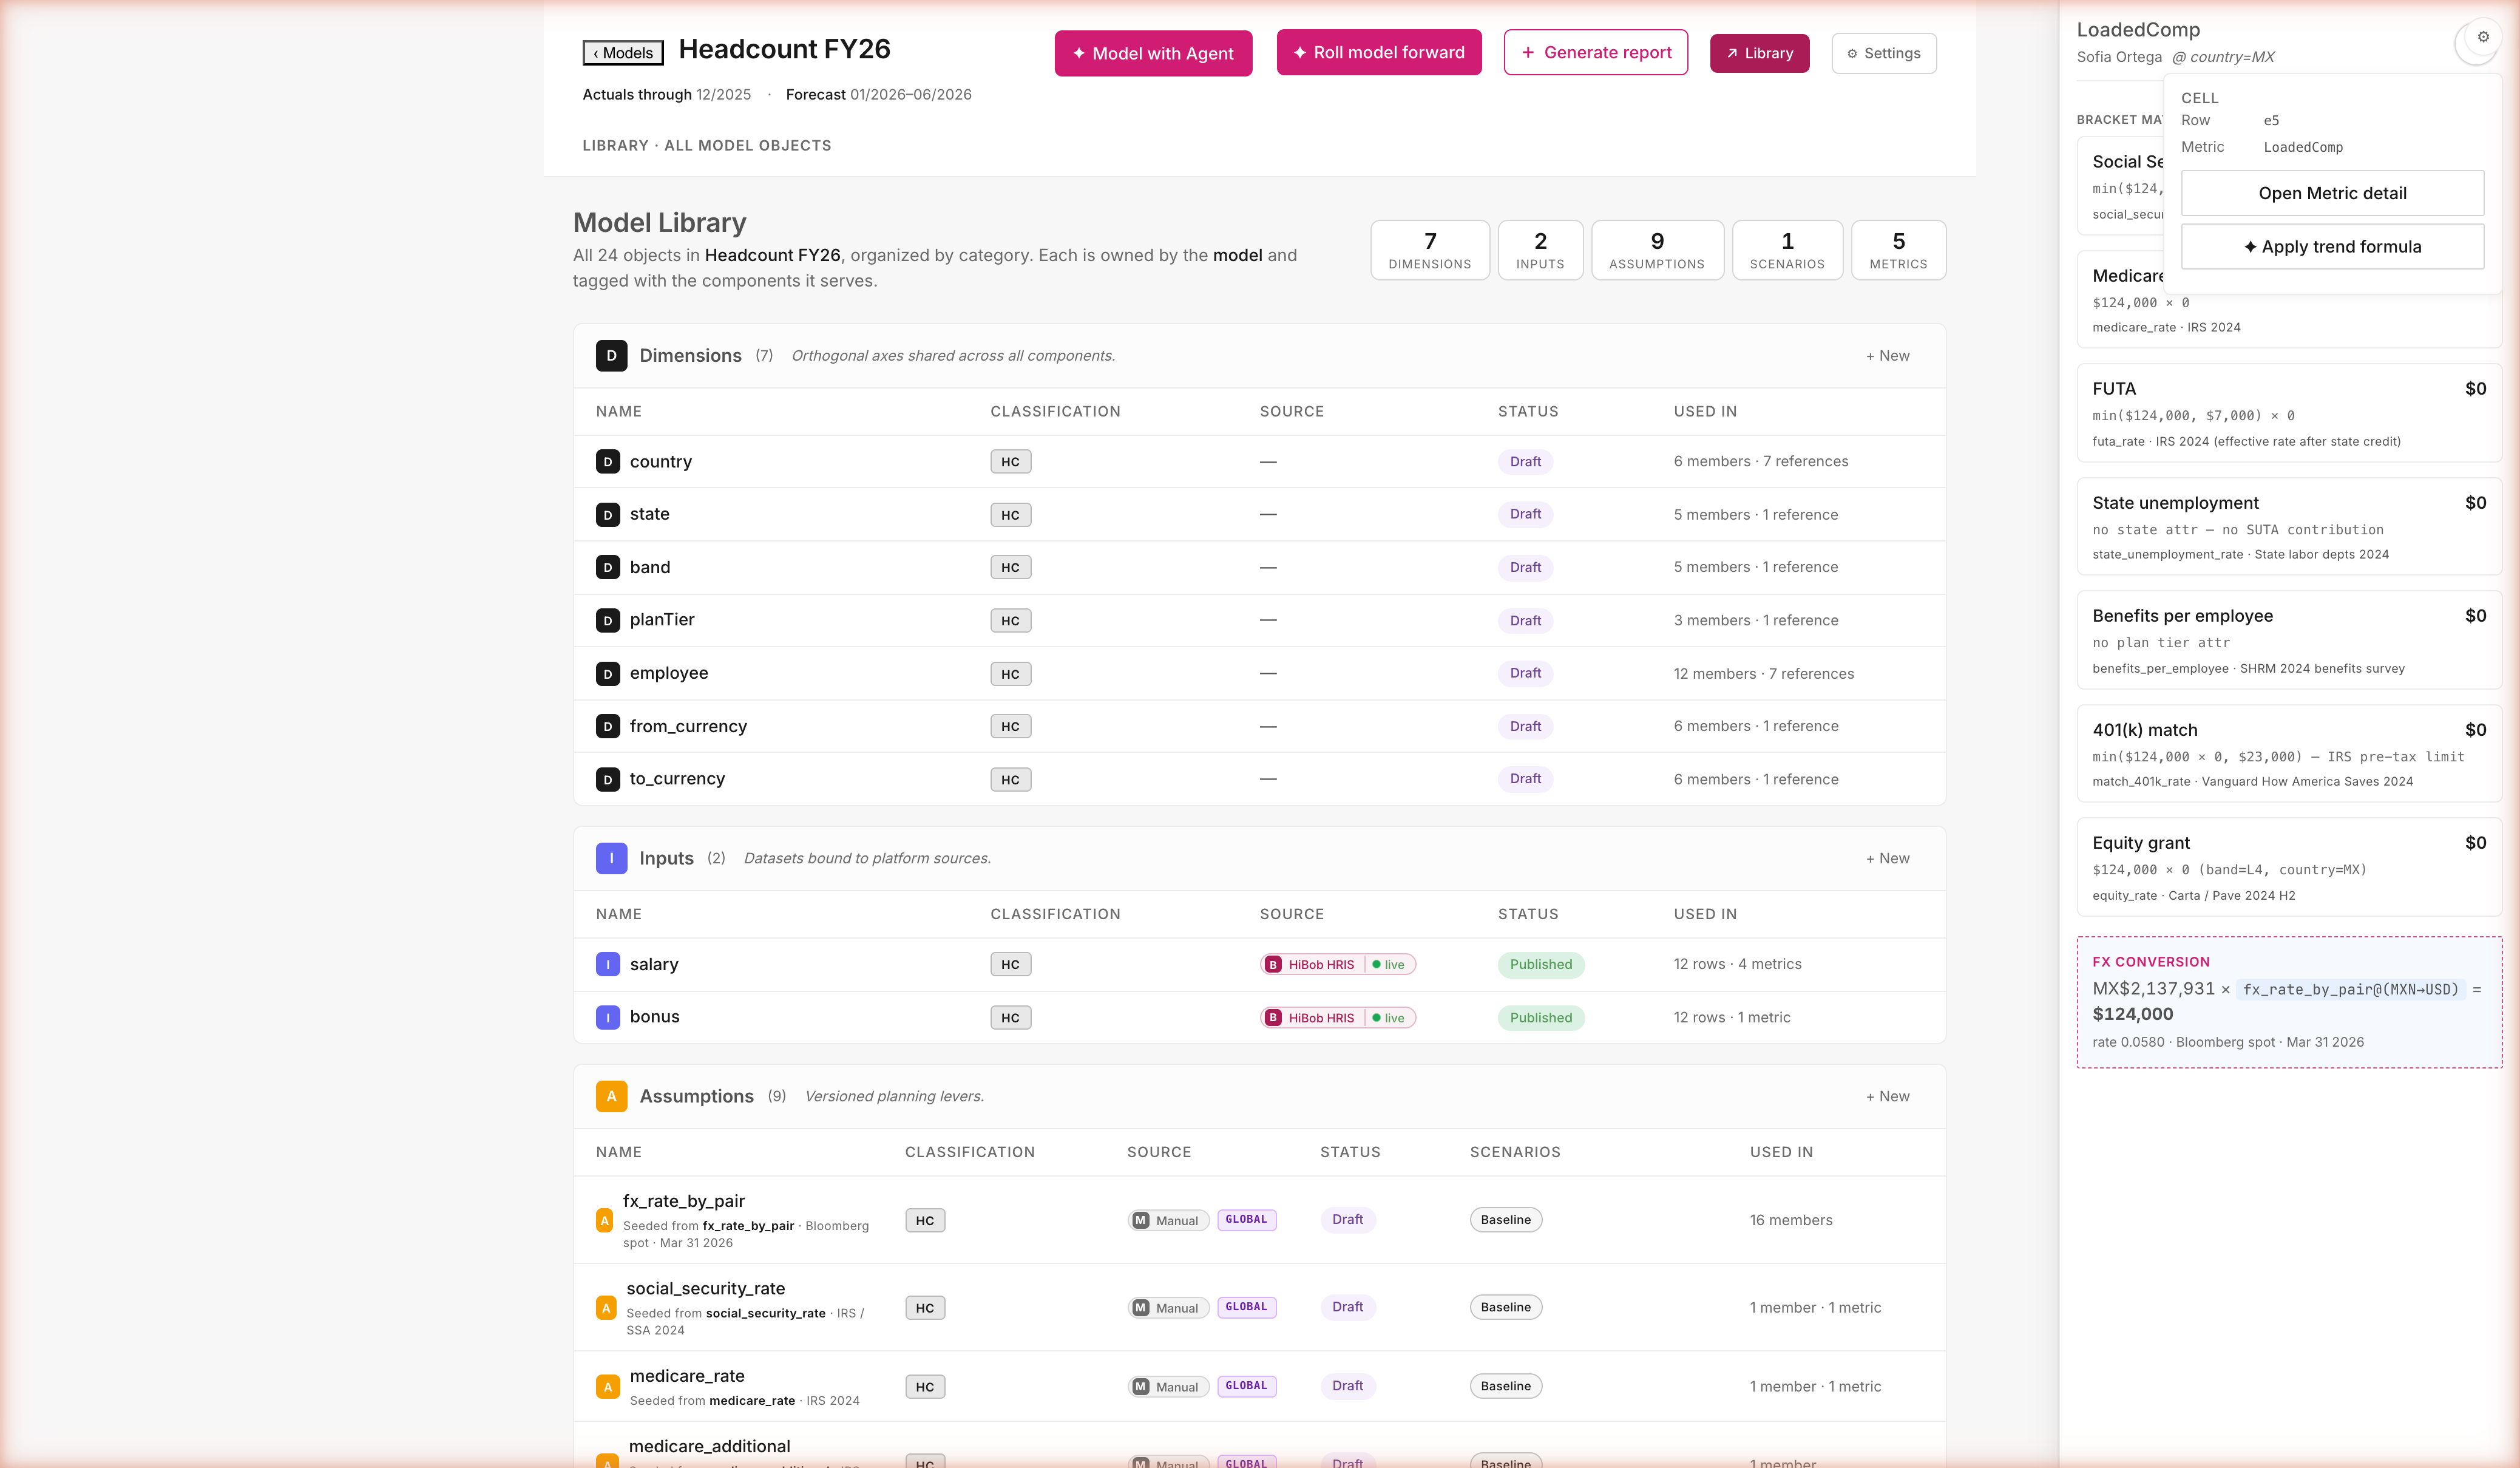
STEP 4 · LIBRARY
Every assumption — who owns it, where it came from, what it affects.
Library shows all the building blocks. Purple "GLOBAL" chip means the assumption is shared across every model in your workspace.
Every assumption lives in one place — not buried in a tab. GLOBAL chips show what's shared across models; edit one and a confirm dialog tells you exactly which models will recalc. No silent forks. Your team's institutional knowledge becomes the catalog defaults. The next model starts smarter than this one.
bobfinance · fy26-budget-deck08 / 22
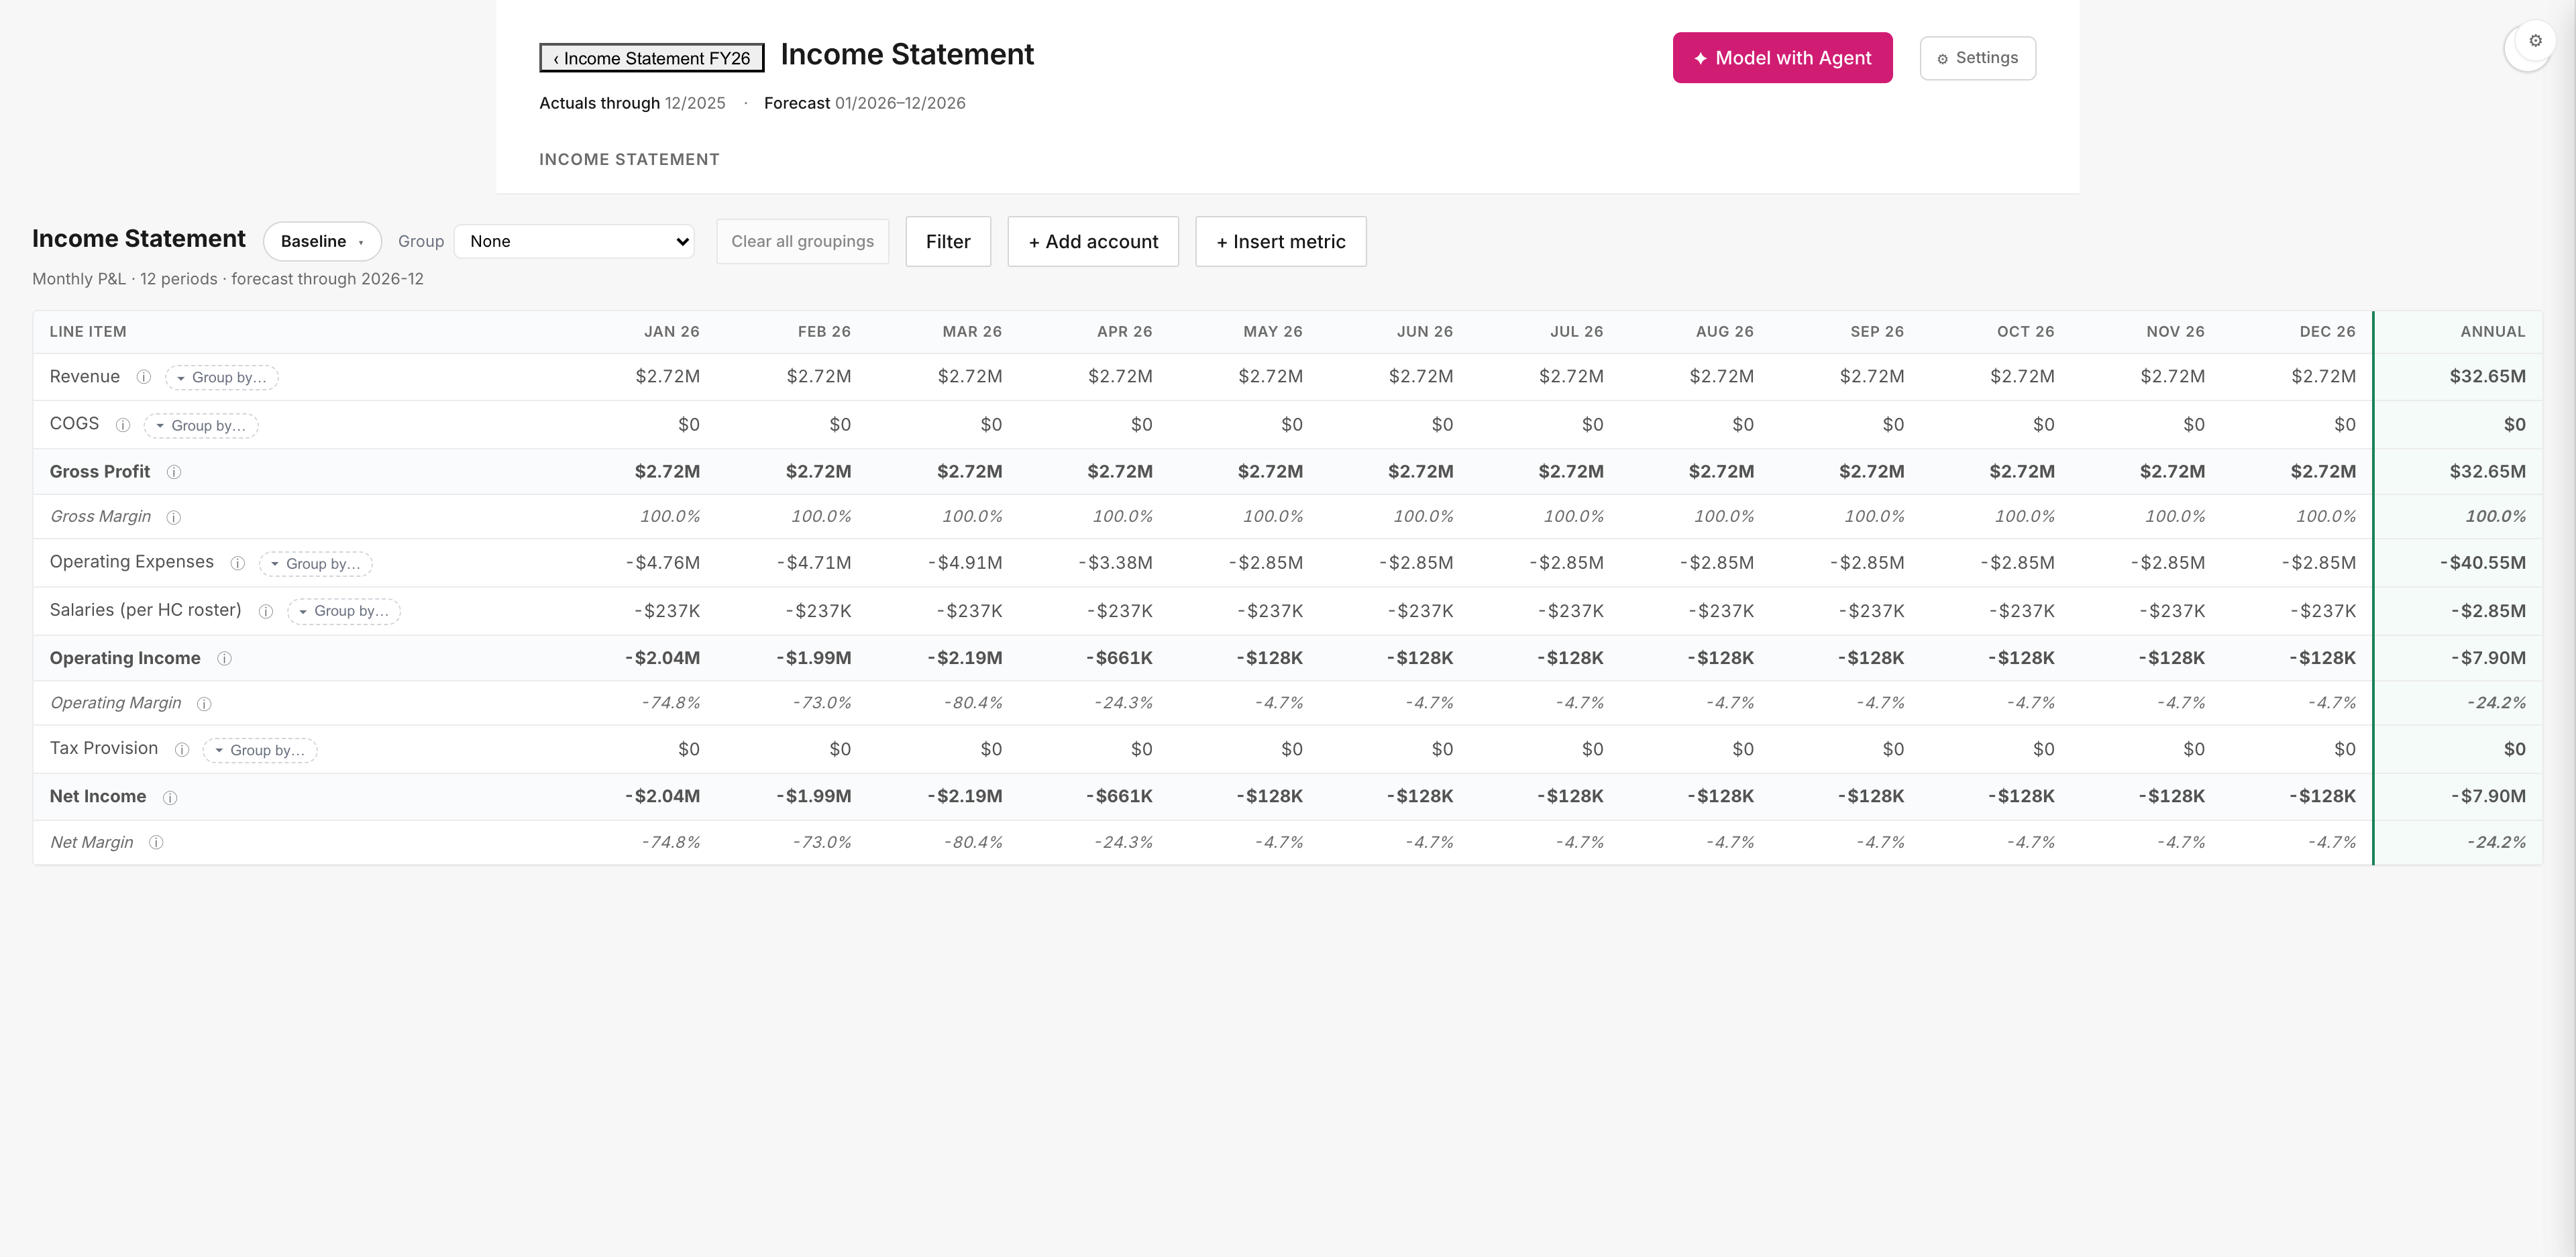
STEP 5 · INCOME STATEMENT
The P&L is already there. No "build it from scratch" wizard.
Open the IS and your real GL accounts are populated — pulled from QuickBooks. Salaries (per HC roster) flows from Headcount automatically.
Open the IS and your QuickBooks GL is already there. No "scaffold first" wizard, no first-time prompt to "build" anything. Salaries on the IS isn't a number you type — it's a pointer to the headcount roster. Hire one more person and this line moves automatically. $28.6M comp lands here for free.
bobfinance · fy26-budget-deck09 / 22
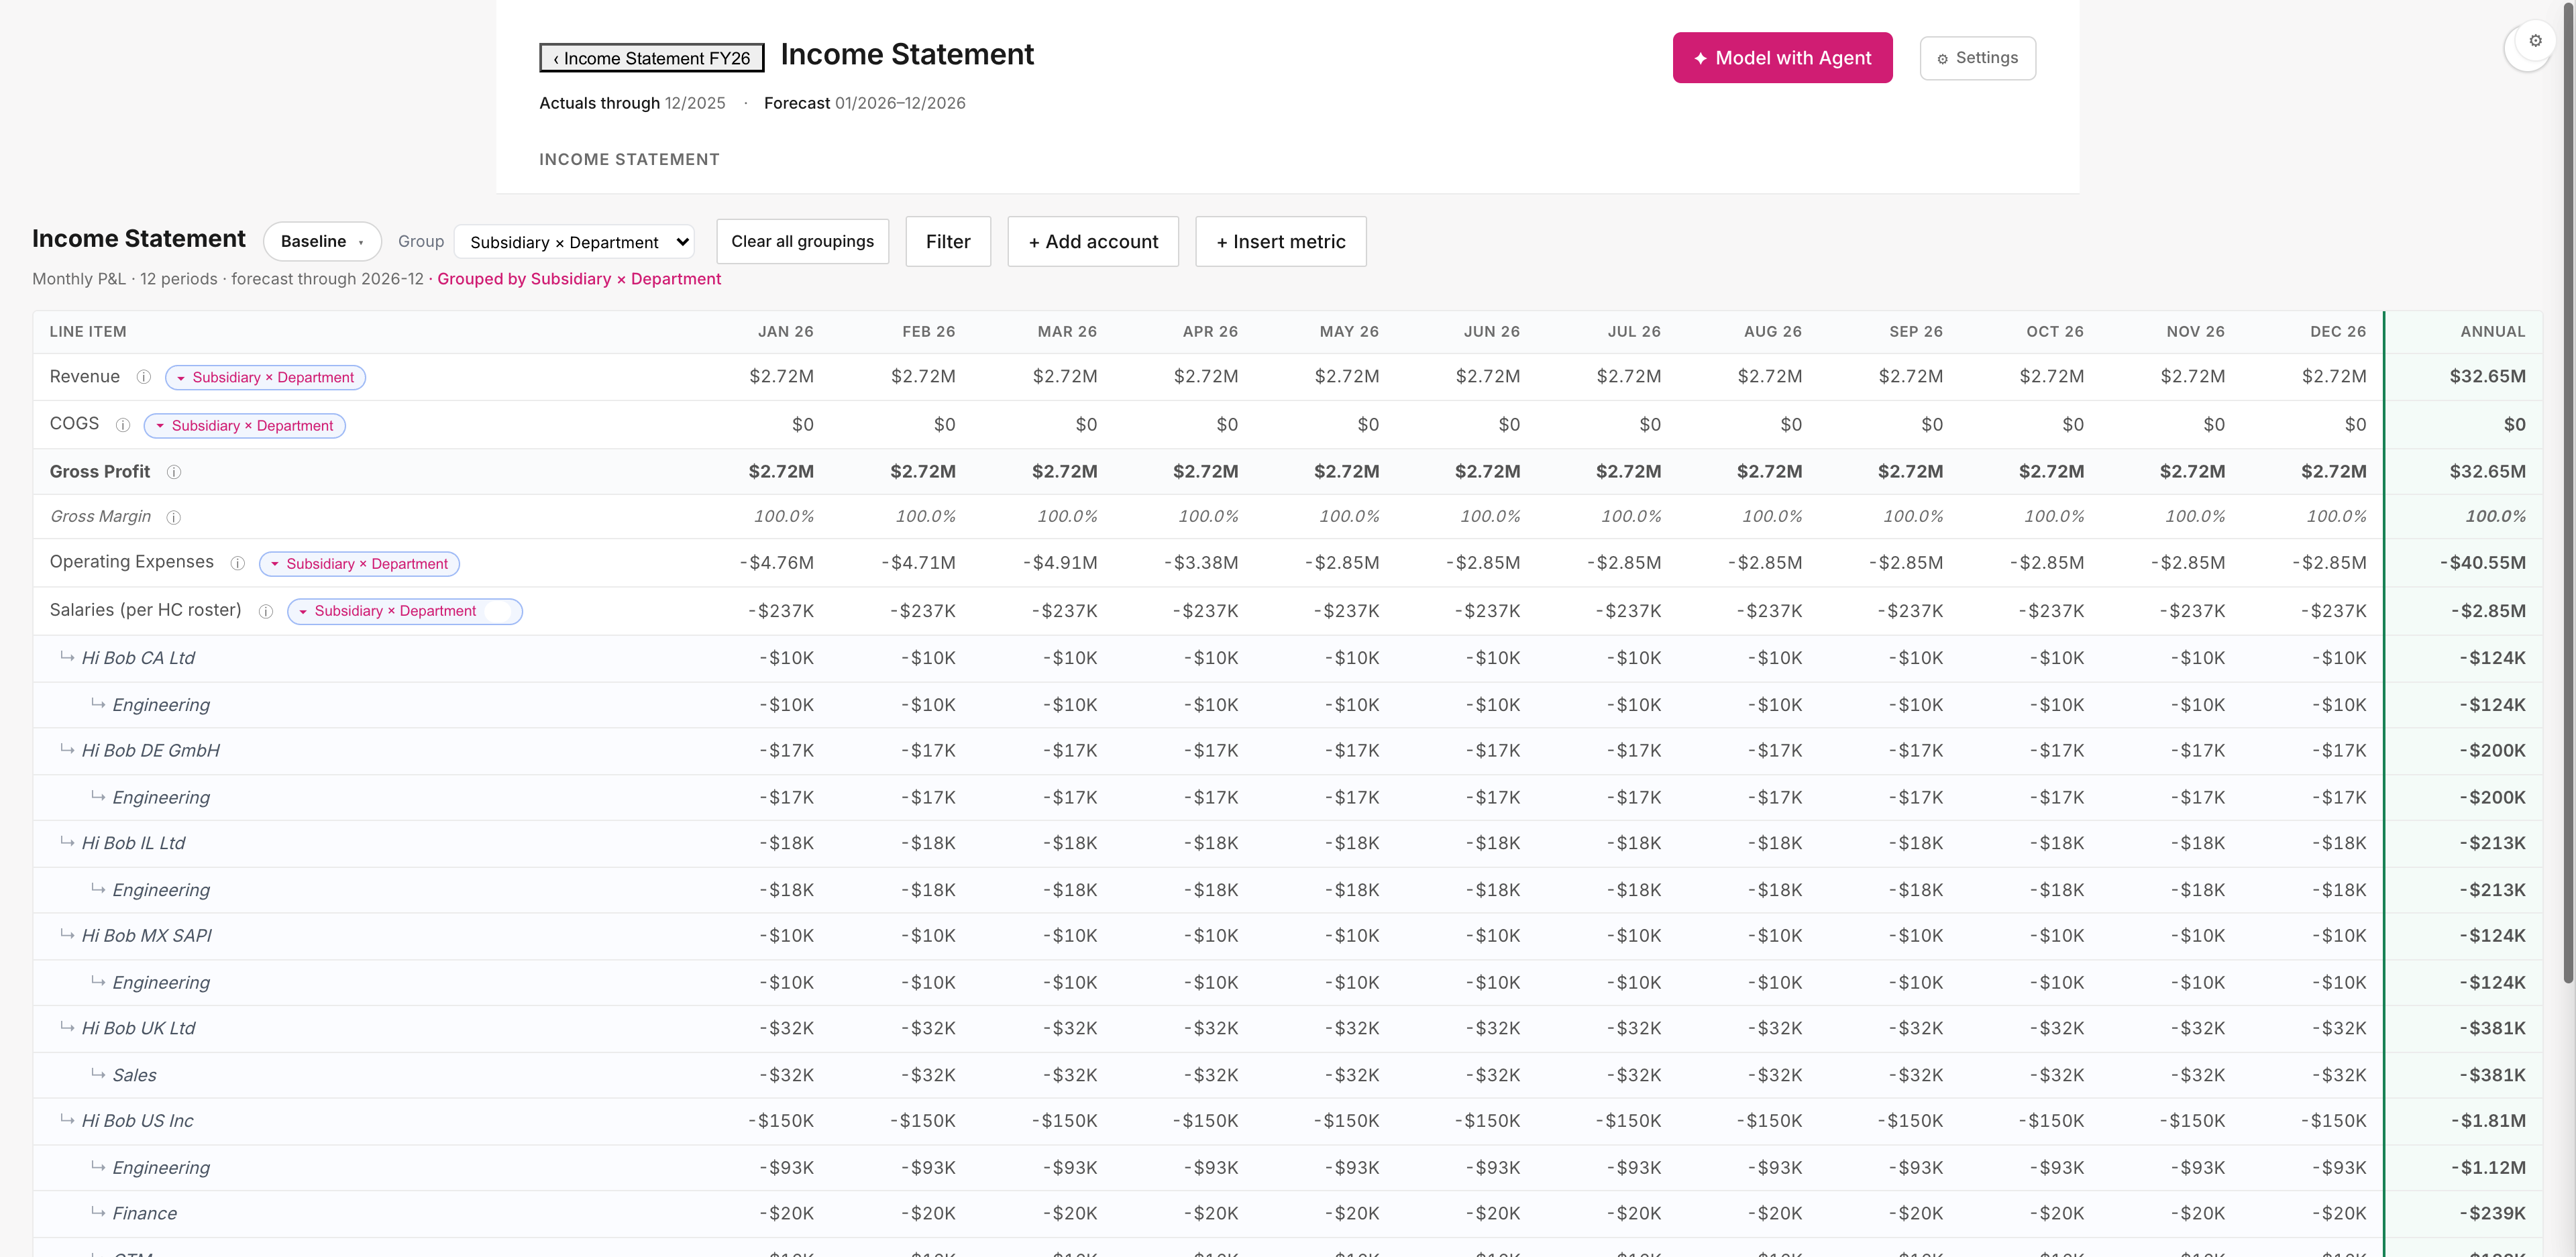
STEP 6 · DIMENSIONALITY
Group by Subsidiary × Department — per-employee comp lands at the right intersection.
Click Group → select Subsidiary × Department. Salaries expands into nested per-(entity, org) sub-rows.
Entity-level reporting without the manual allocation. Each subsidiary files its own P&L; the comp split has to be right. Sofia's MXN comp lands in Hi Bob MX SAPI · Engineering. Hi Bob US Inc breaks into all four orgs. You set the dims once at model creation; the engine pivots end-to-end automatically.
bobfinance · fy26-budget-deck10 / 22
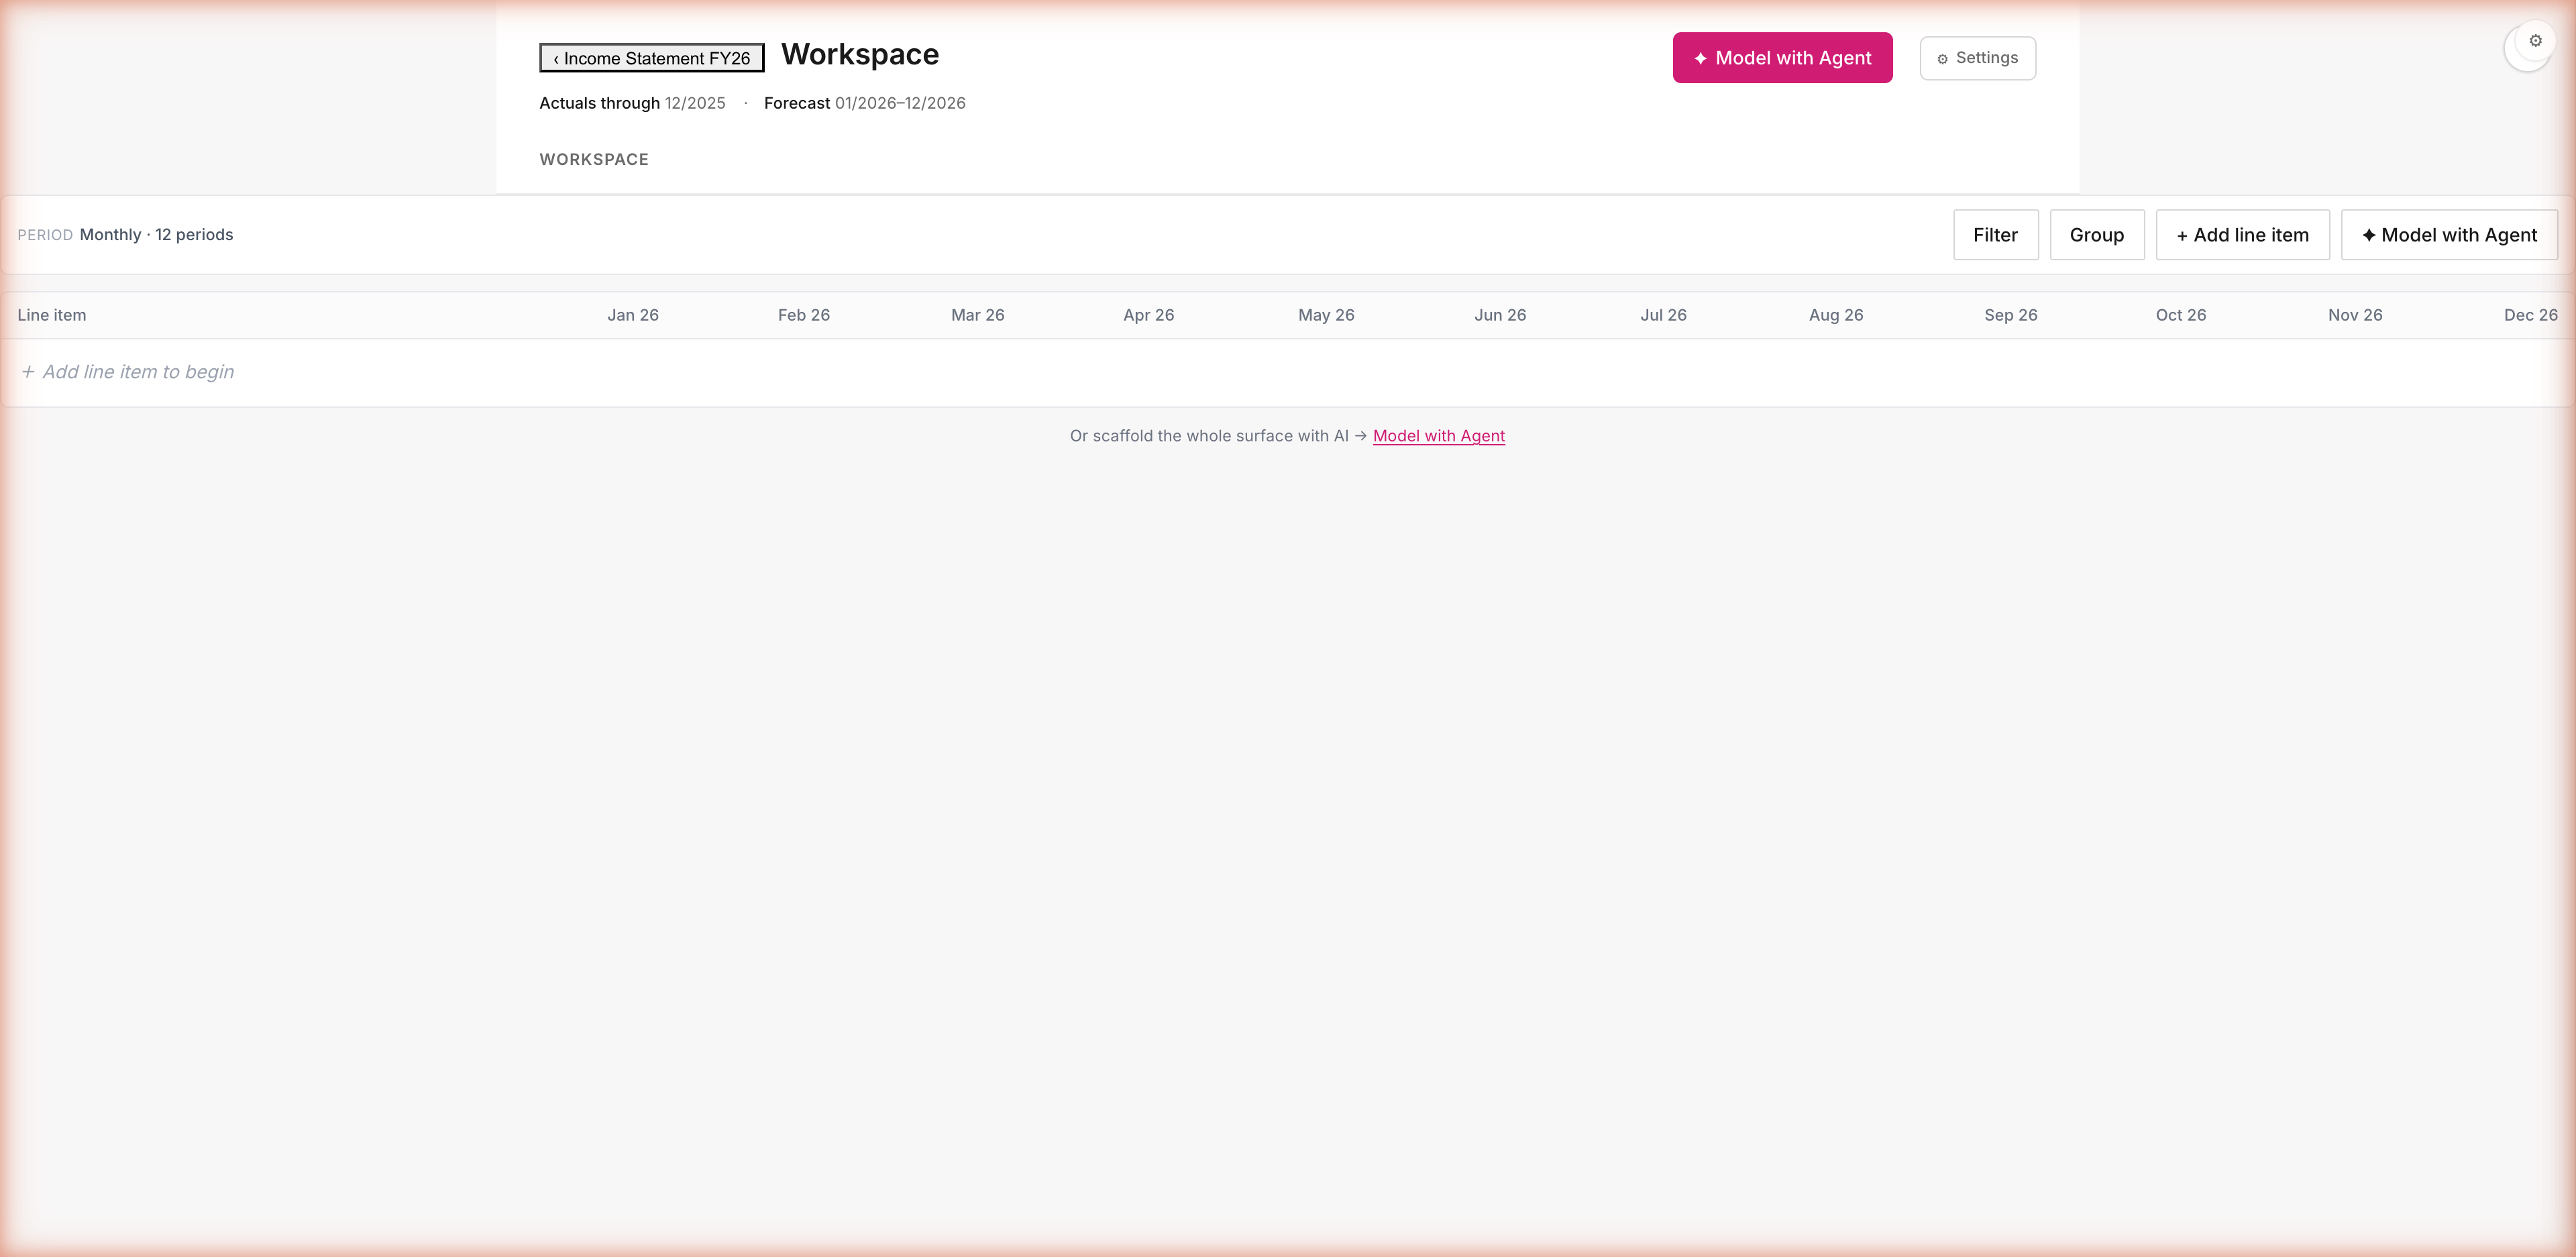
STEP 7 · WORKSPACE (BLANK)
Build a revenue model from scratch. Like opening a new spreadsheet.
Workspace is the blank canvas — period columns ready, ghost row inviting input. Click + Add line item or ask the agent to scaffold.
Workspace is a blank spreadsheet — for everything that isn't HC, IS, or BS. ARR forecast · capacity model · win-rate funnel · custom KPIs — same engine, different shape. Drop in rows yourself, or ask the agent to scaffold the surface for you. Either way, the same audit trail comes with it.
bobfinance · fy26-budget-deck11 / 22
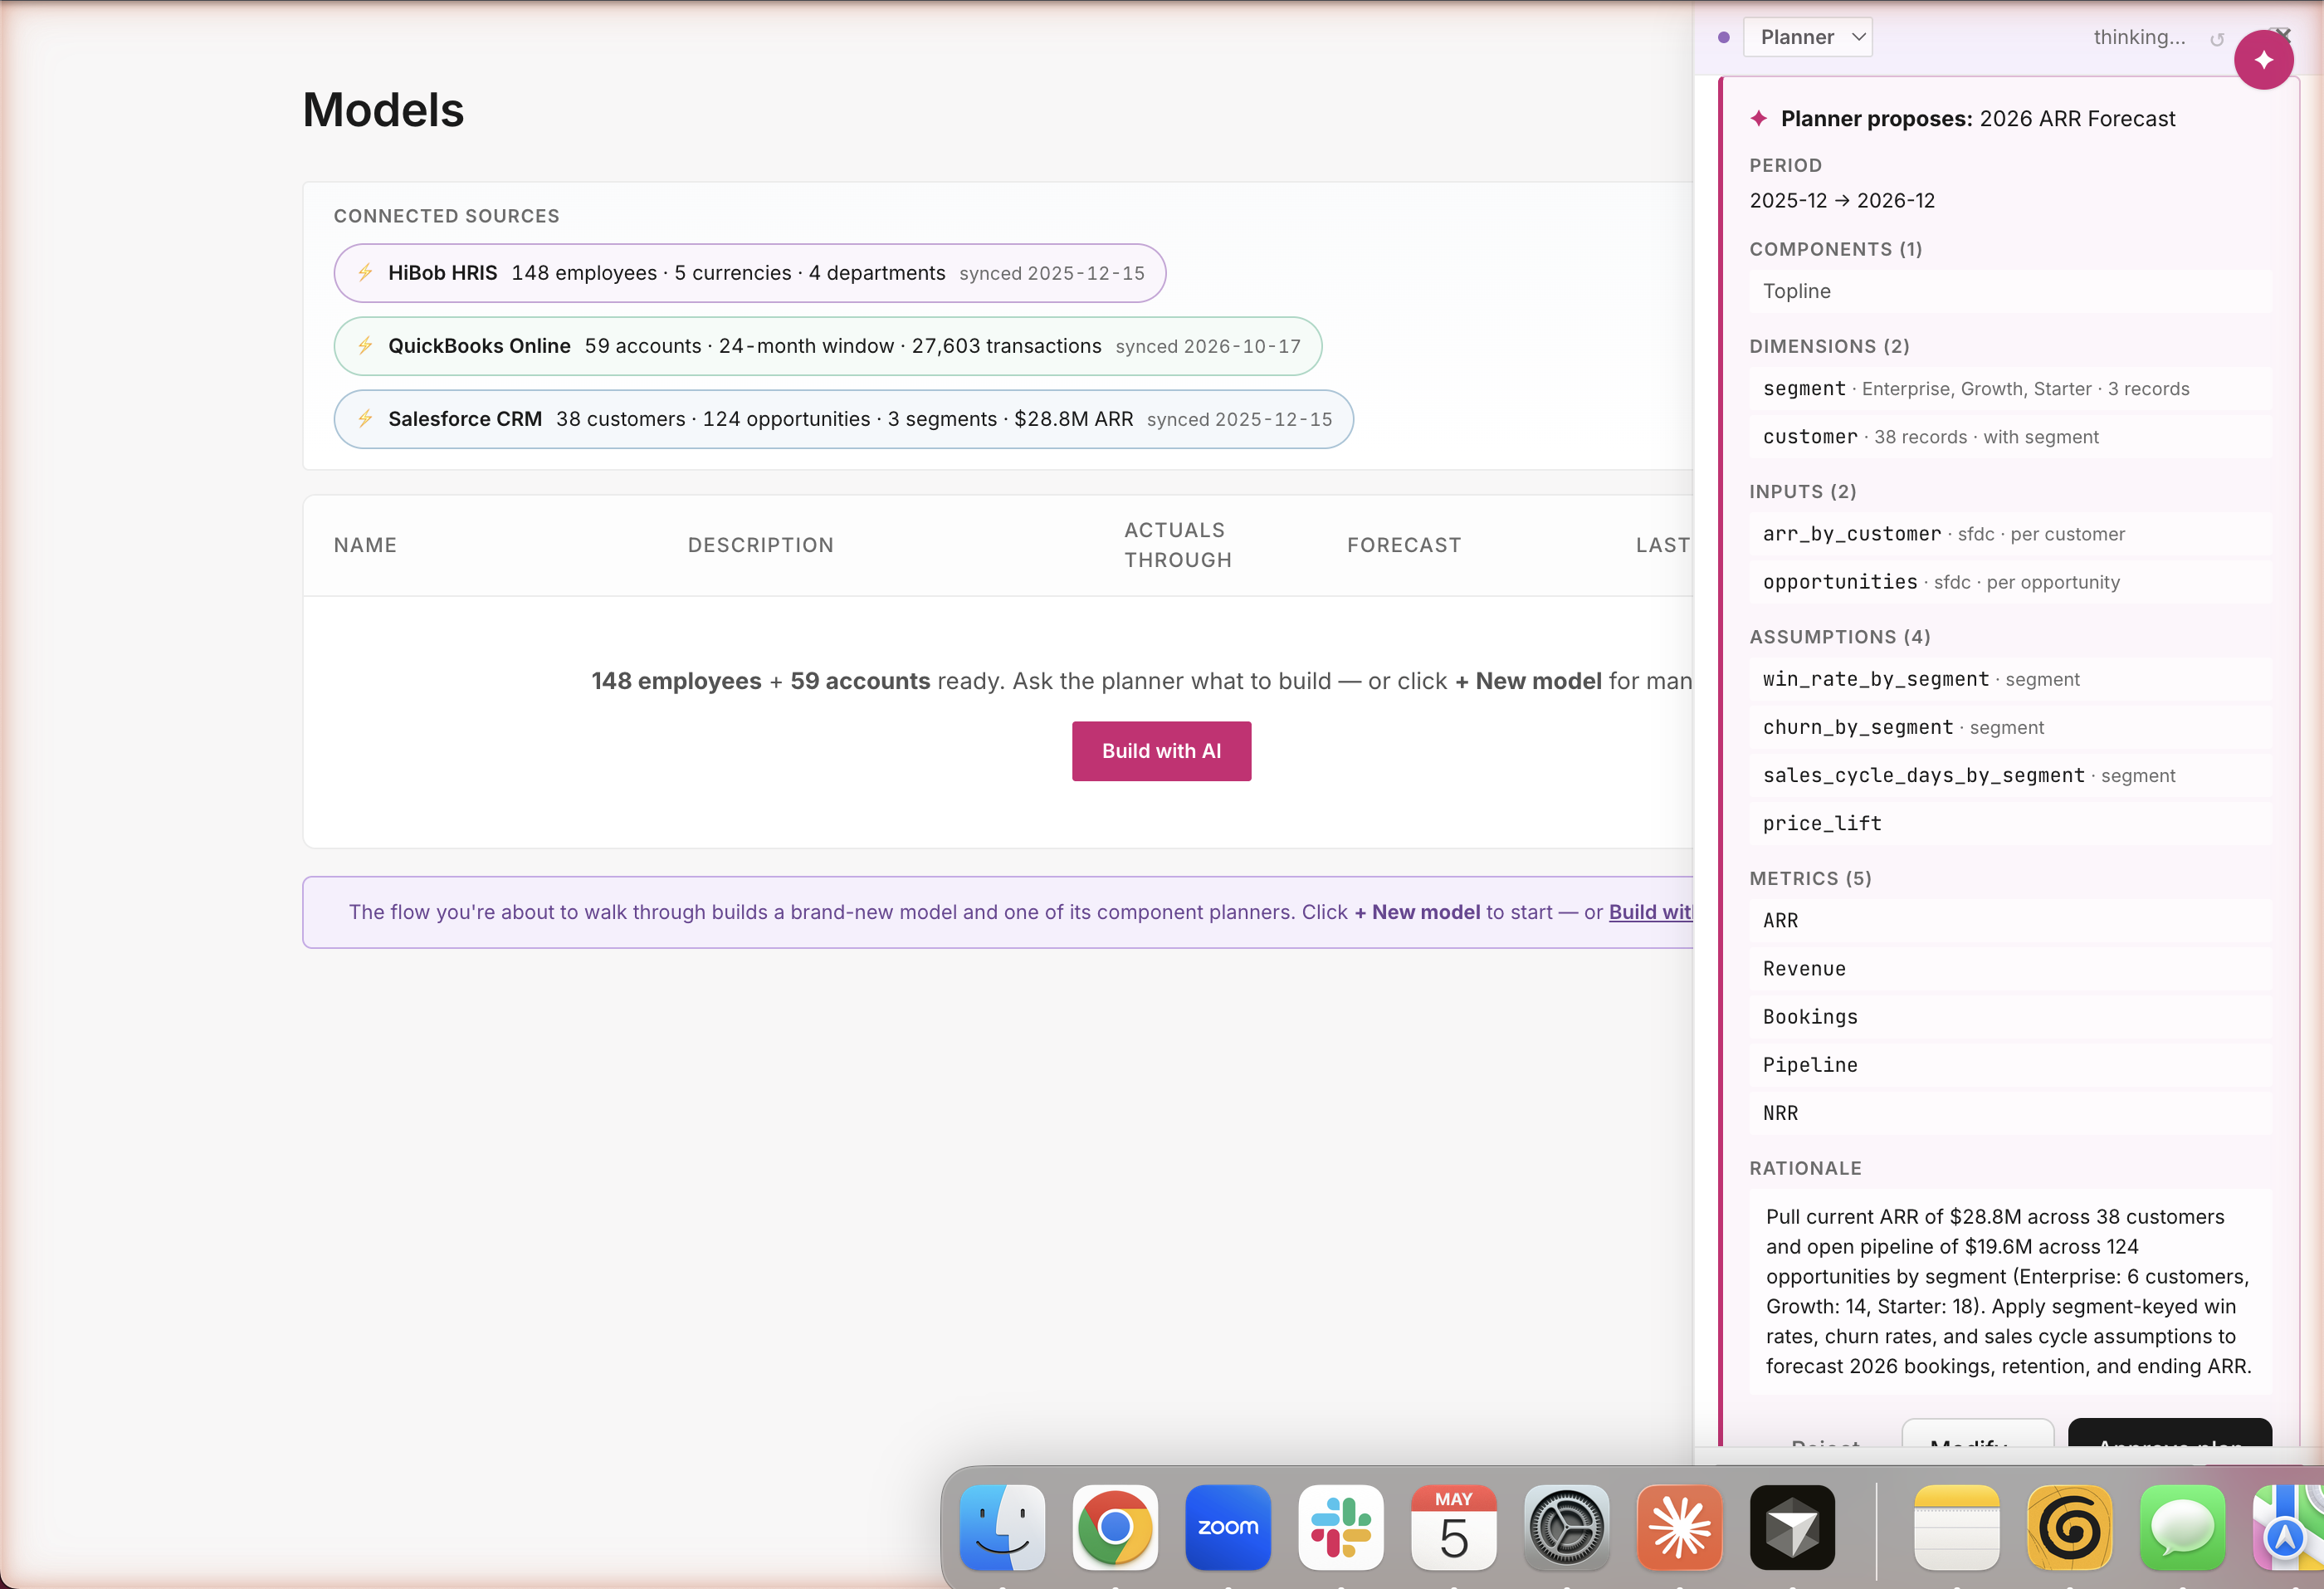
STEP 7b · ASK THE AGENT
"Build me a 2026 ARR forecast from Salesforce." The agent reads your pipeline and shows you the plan first.
One sentence in chat. The Planner reads $19.5M of live Salesforce pipeline, segments it (Enterprise / Growth / Starter), proposes win rates, churn, NRR, bookings — every row cited, nothing built yet.
This is how you go from blank to a $32.6M revenue forecast in 30 seconds. The agent doesn't guess your assumptions — it reads your real pipeline, segments it, and proposes the model structure. You see every input, assumption, metric before anything is built. Drop what you don't want with × buttons; approve what's left. Same plan-first guardrails as Headcount — same audit trail, different surface.
bobfinance · fy26-budget-deck12 / 22
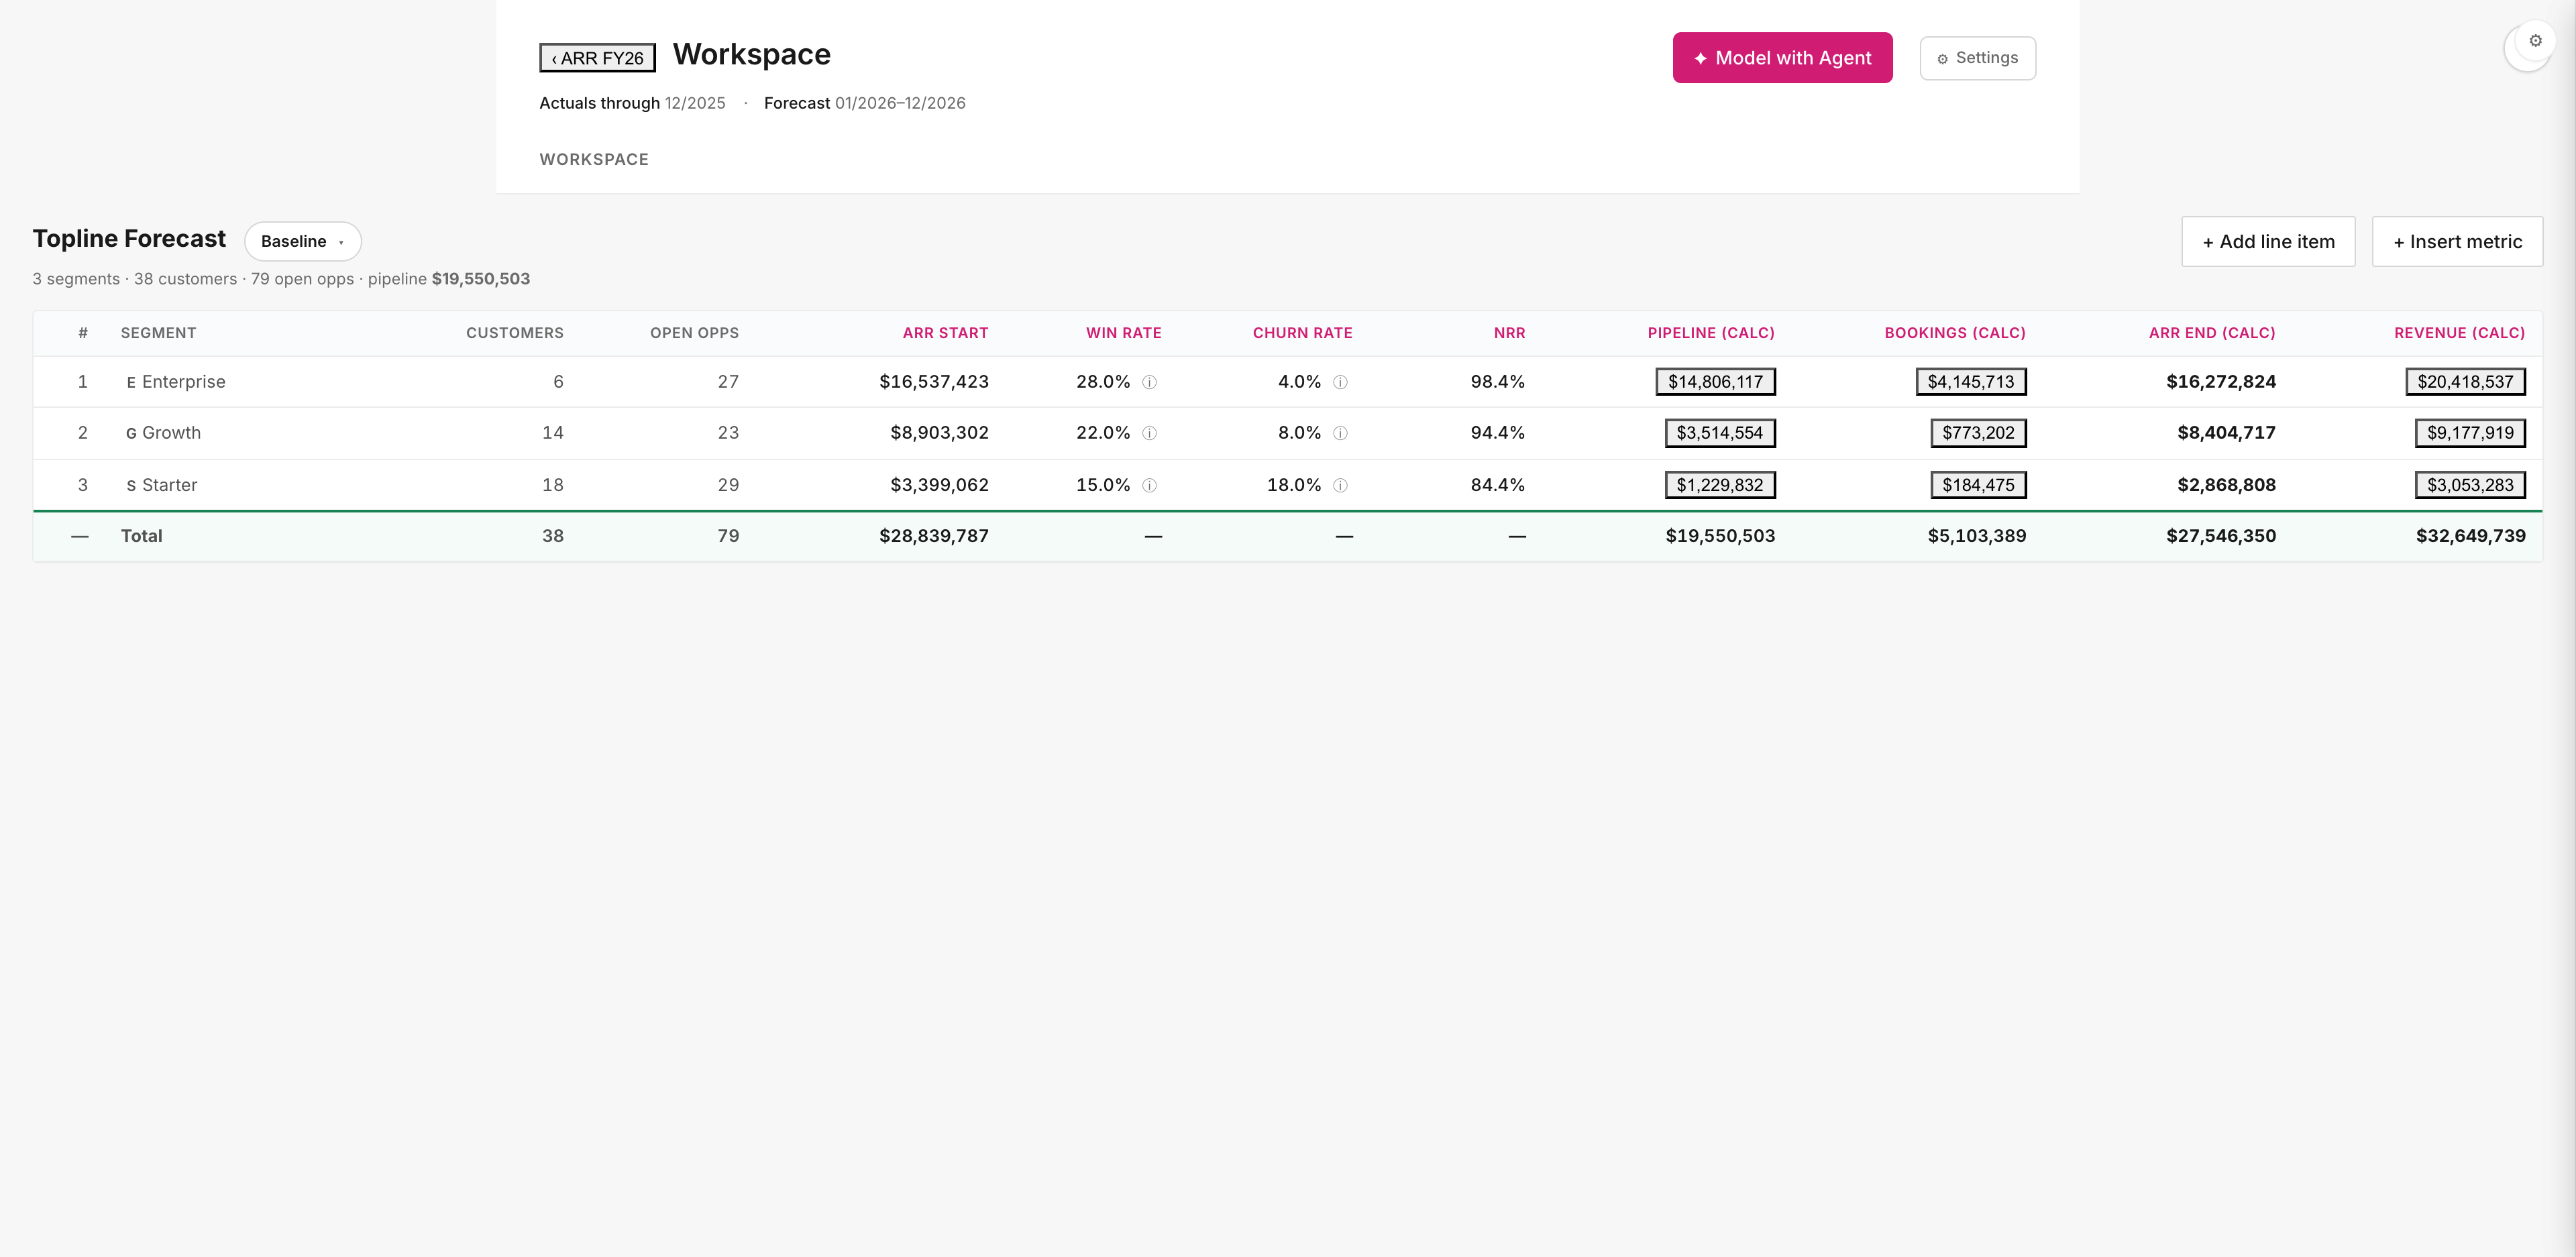
STEP 8 · REVENUE FORECAST
$28.8M ARR start → $32.6M revenue forecast.
Three segments — Enterprise, Growth, Starter — built bottoms-up against $19.5M of real Salesforce pipeline.
Bottom-up against real Salesforce pipeline — not a topline assumption. $19.5M of pipeline · 38 customers · 79 open opps split into 3 segments. Click any cell — see the formula, the Salesforce records, the catalog assumption that drove the math. Survives board scrutiny because the receipts are stapled to it.
bobfinance · fy26-budget-deck13 / 22
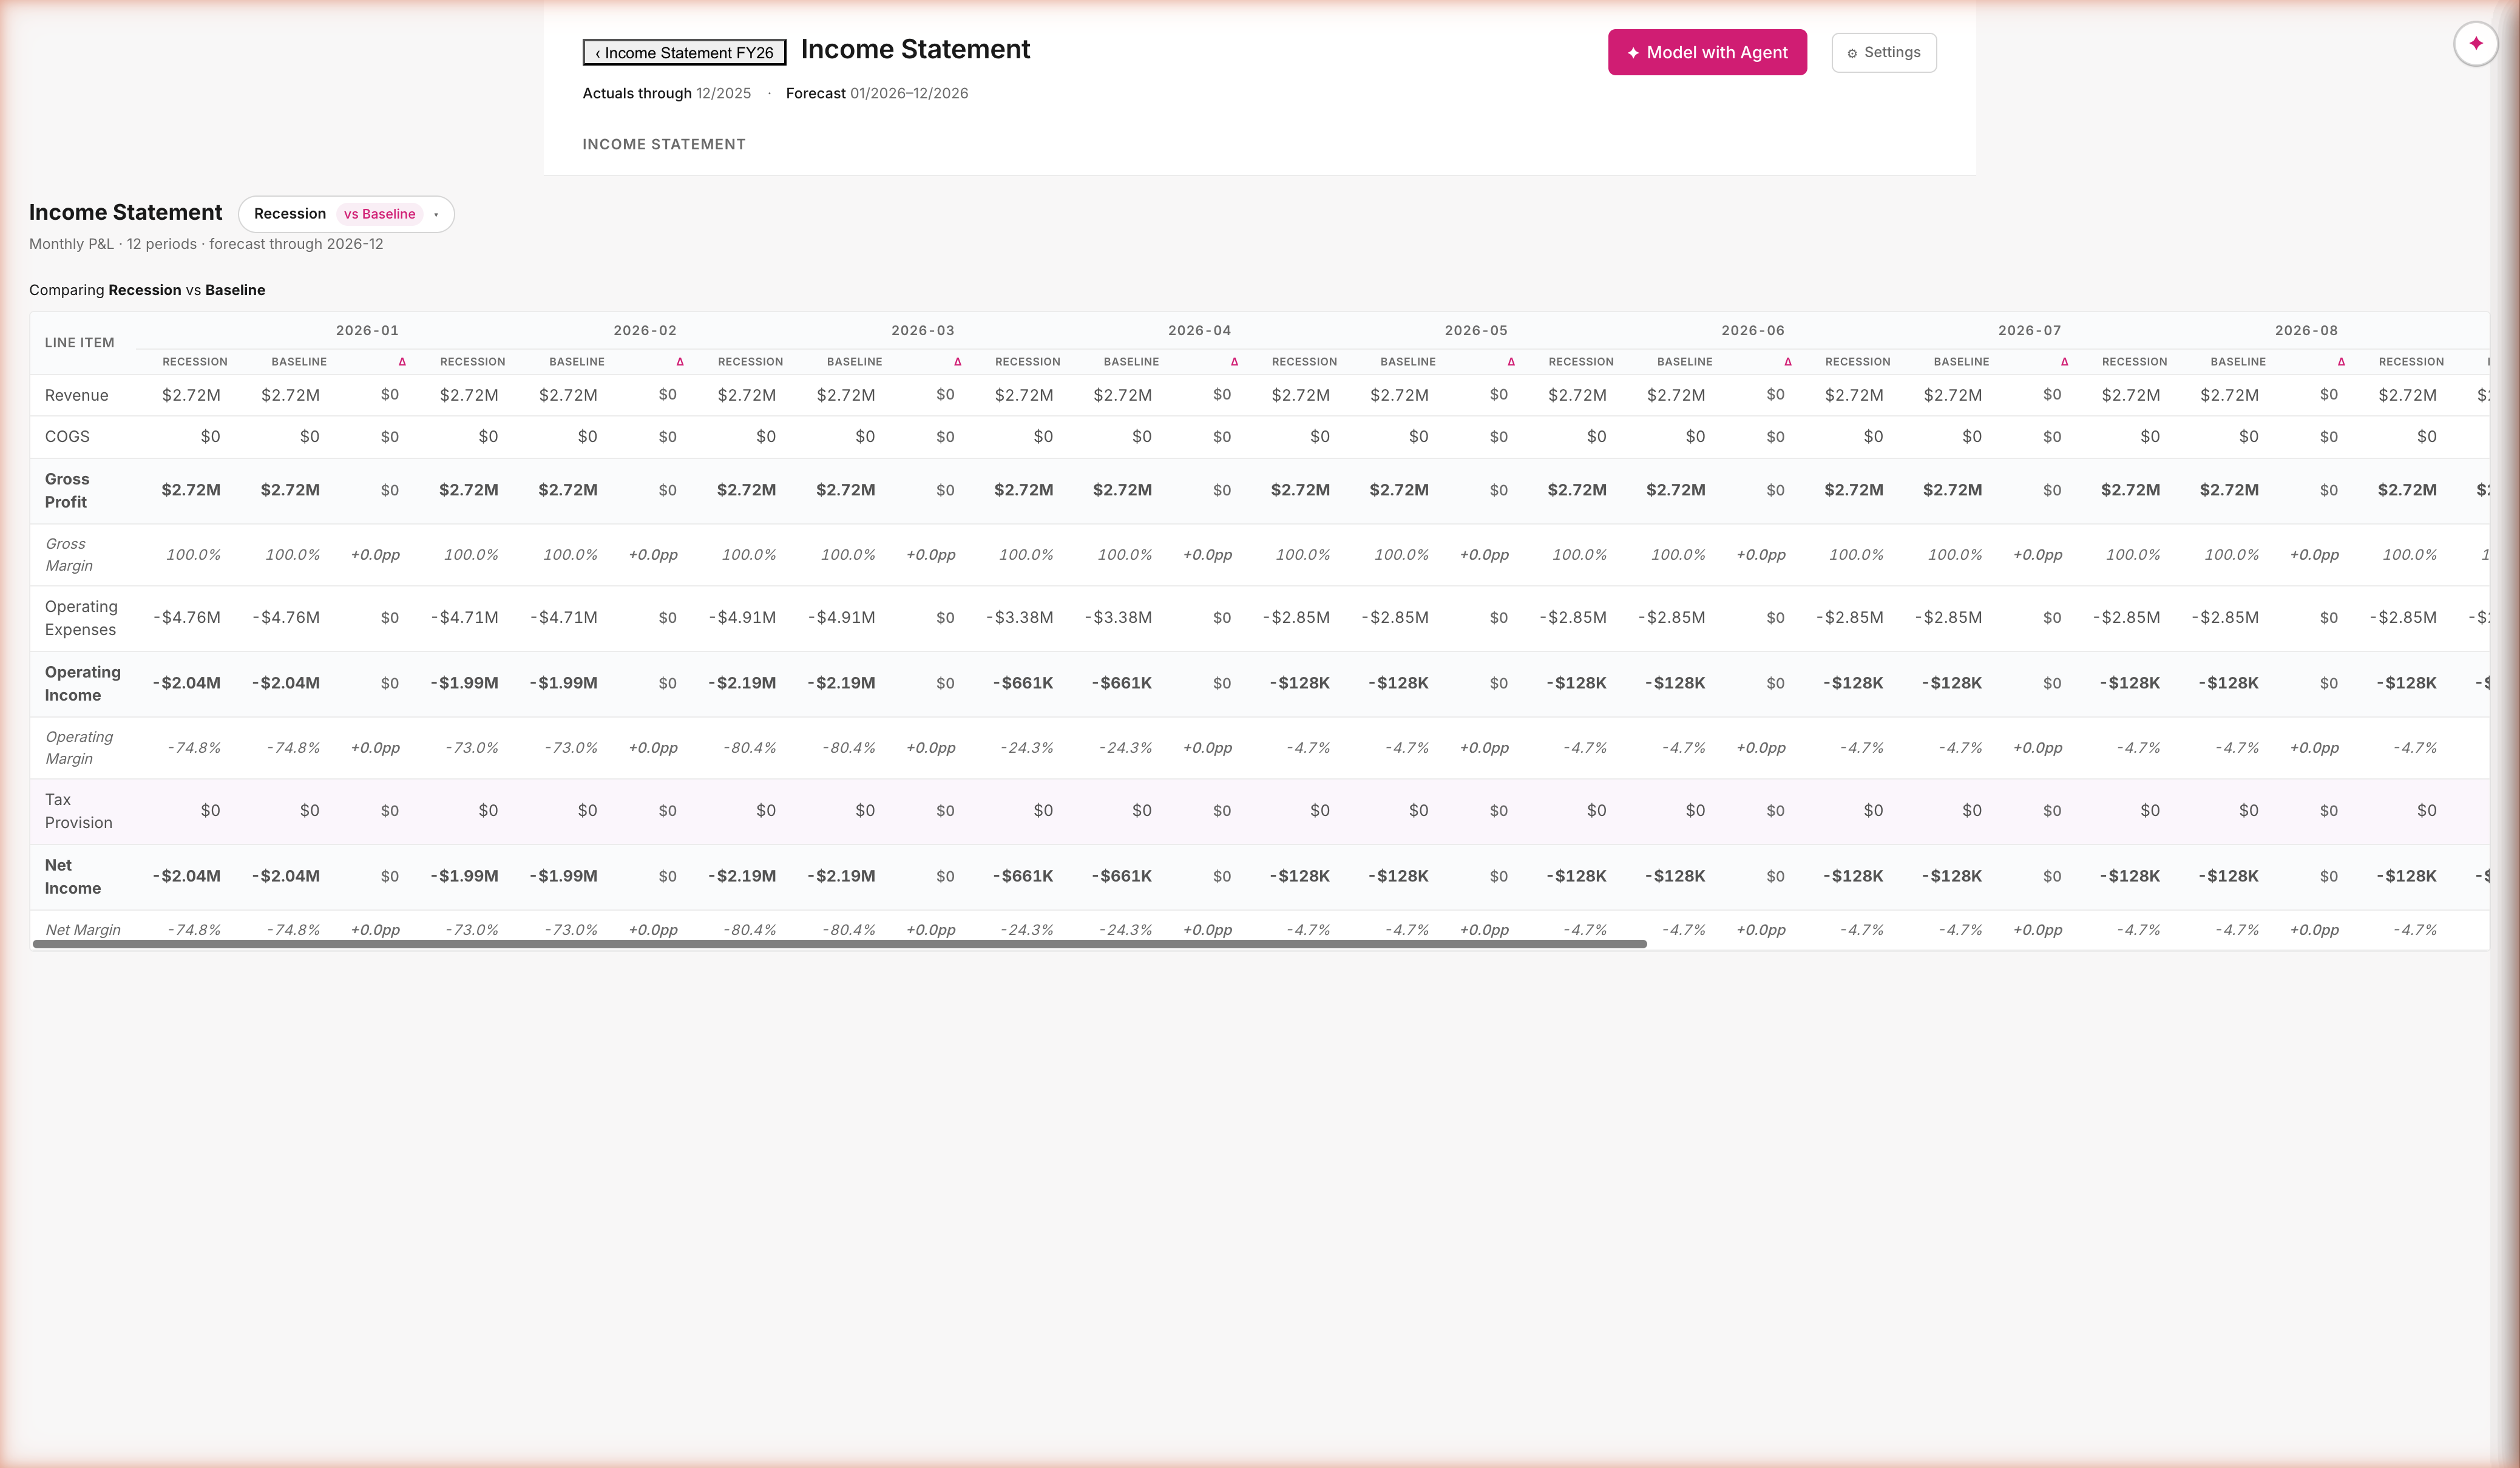
STEP 10 · STRESS TEST
"What if there's a recession?" Spin up a copy, change one number, compare side-by-side.
Spin up a Recession scenario, change one assumption, see the side-by-side delta on every line of the P&L.
Scenario planning in 30 seconds, not 2 days. Recession isn't a copy of Baseline — it's a 1-row override; the diff is computed on demand, not authored by hand. Twenty assumptions can move; the audit trail tells you which one drove the gap. The board asks "what if;" you answer before they finish the question.
bobfinance · fy26-budget-deck14 / 22
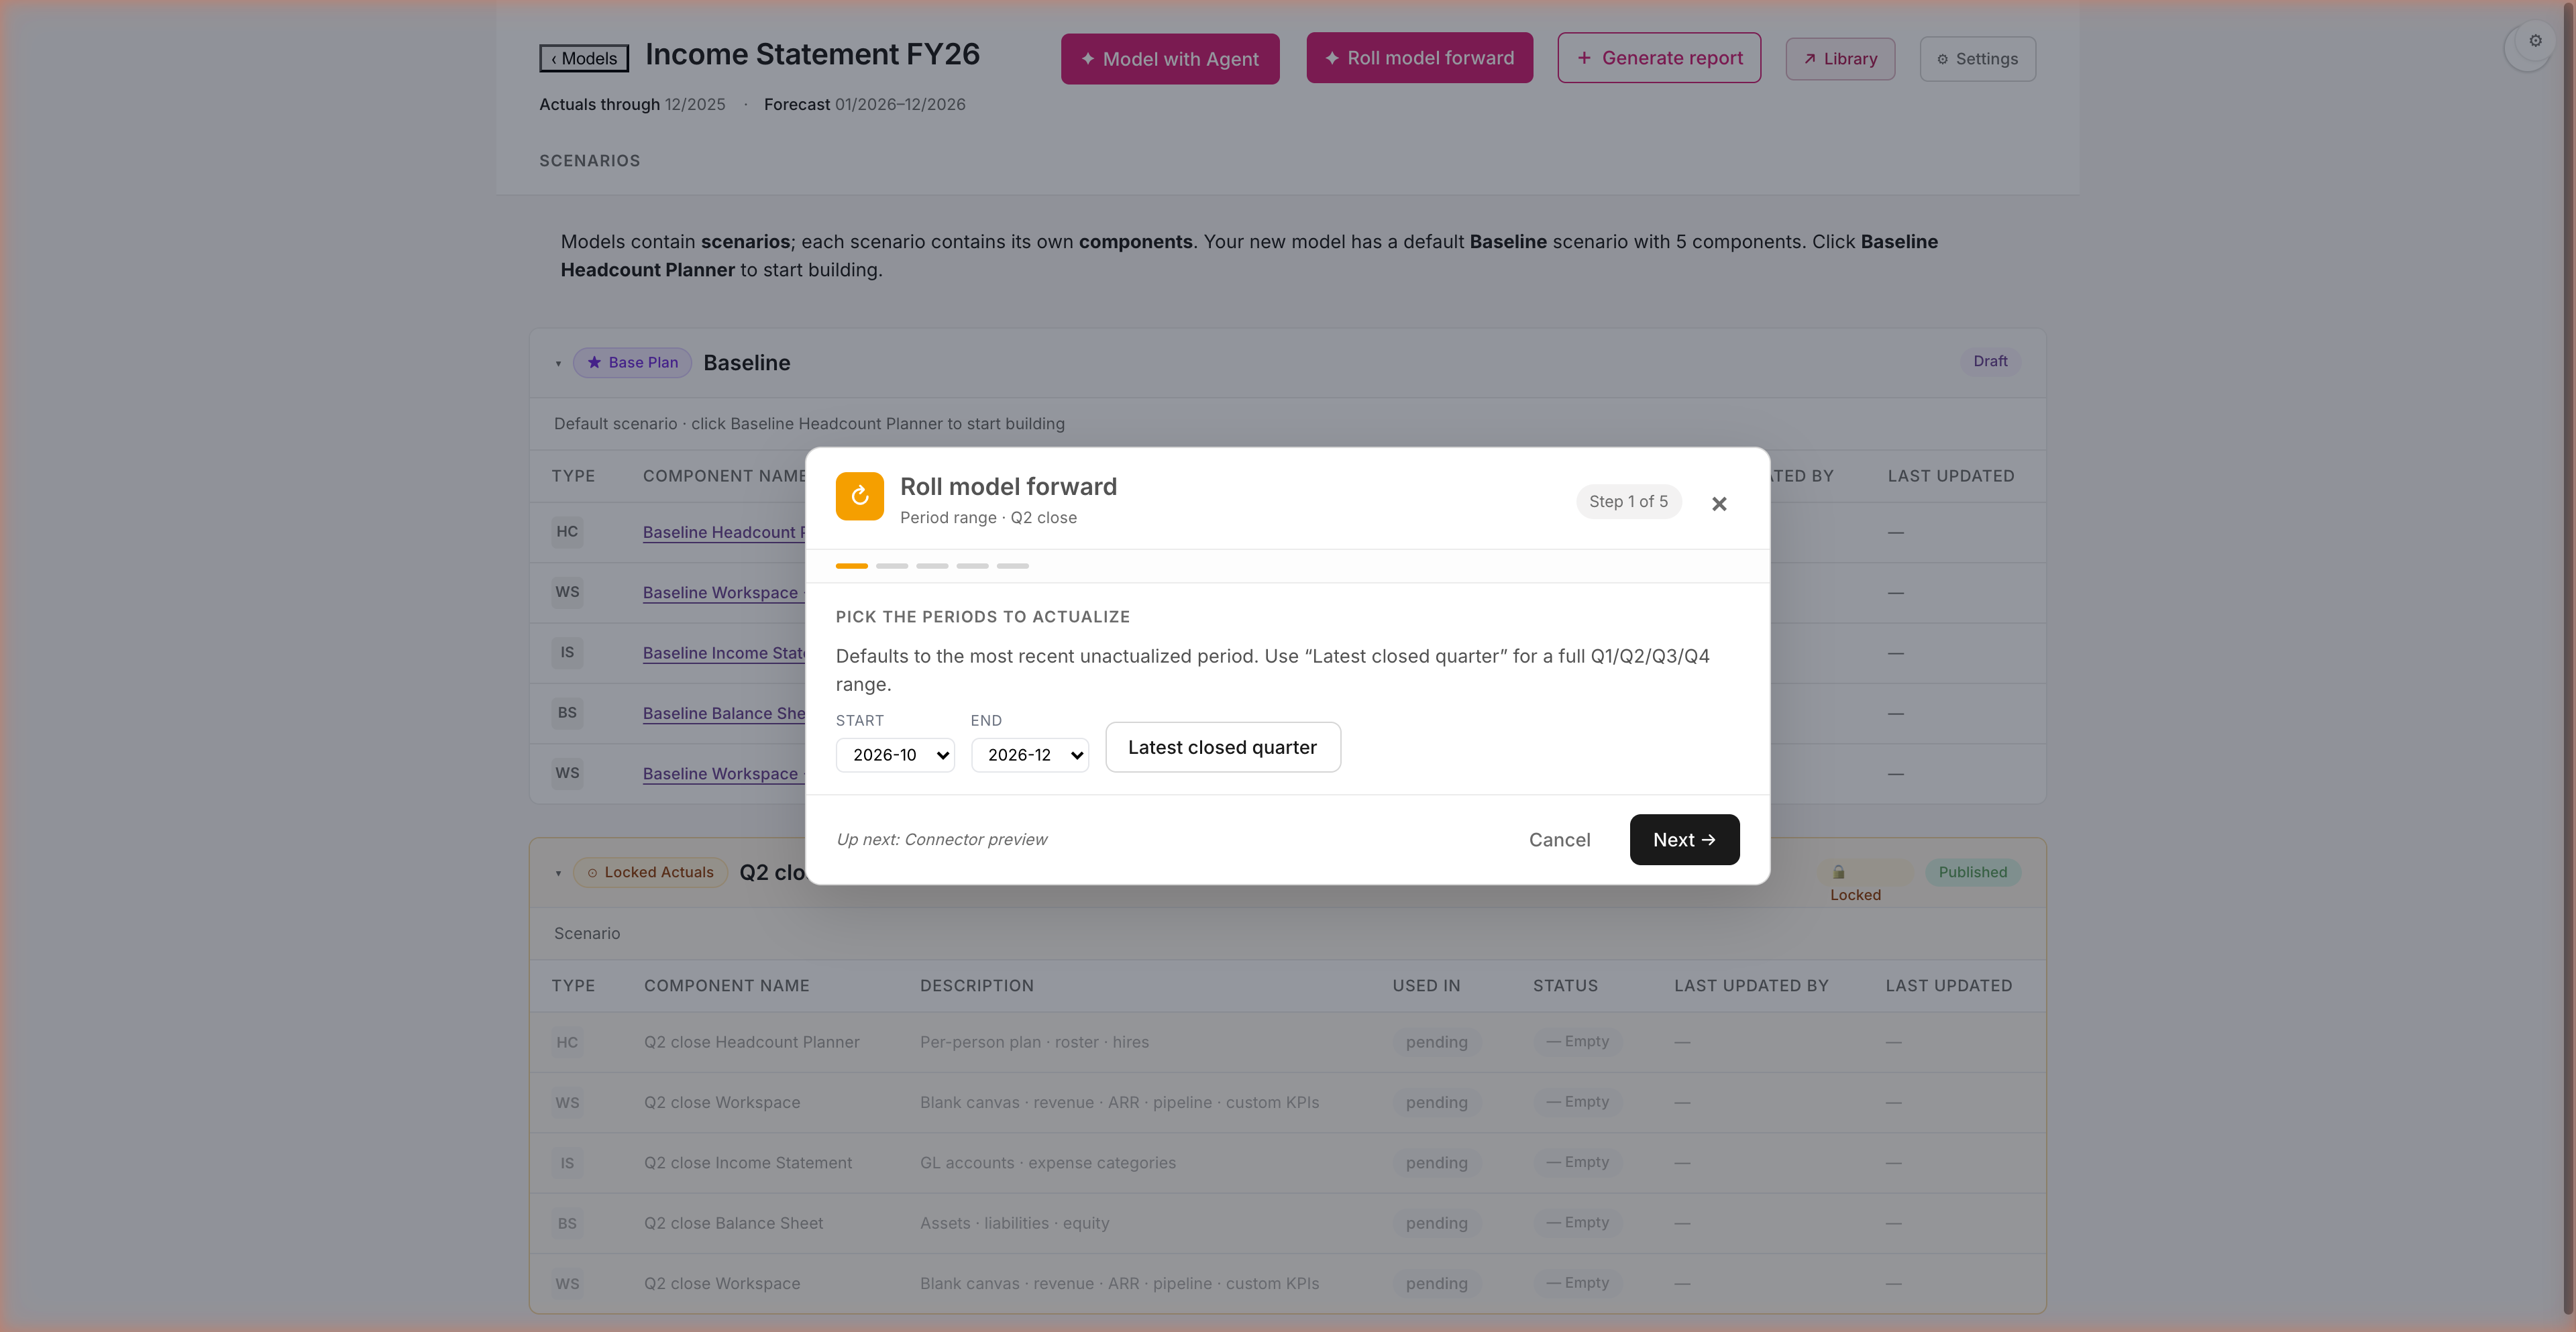
STEP 11 · QUARTER CLOSE
Q1 closed. Roll the model forward.
A five-step wizard: pick the period · preview connector variance · choose how unactualized periods reproject · branch or overwrite · review & confirm.
The 90-day ritual, finally automated. Pick the closed quarter; the wizard handles freeze-and-branch end-to-end. Q1 actuals are landed; Q2-Q4 stays editable; nothing in your forecast got overwritten by surprise. The budget becomes a living plan you steward across the year, not a January artifact.
bobfinance · fy26-budget-deck15 / 22
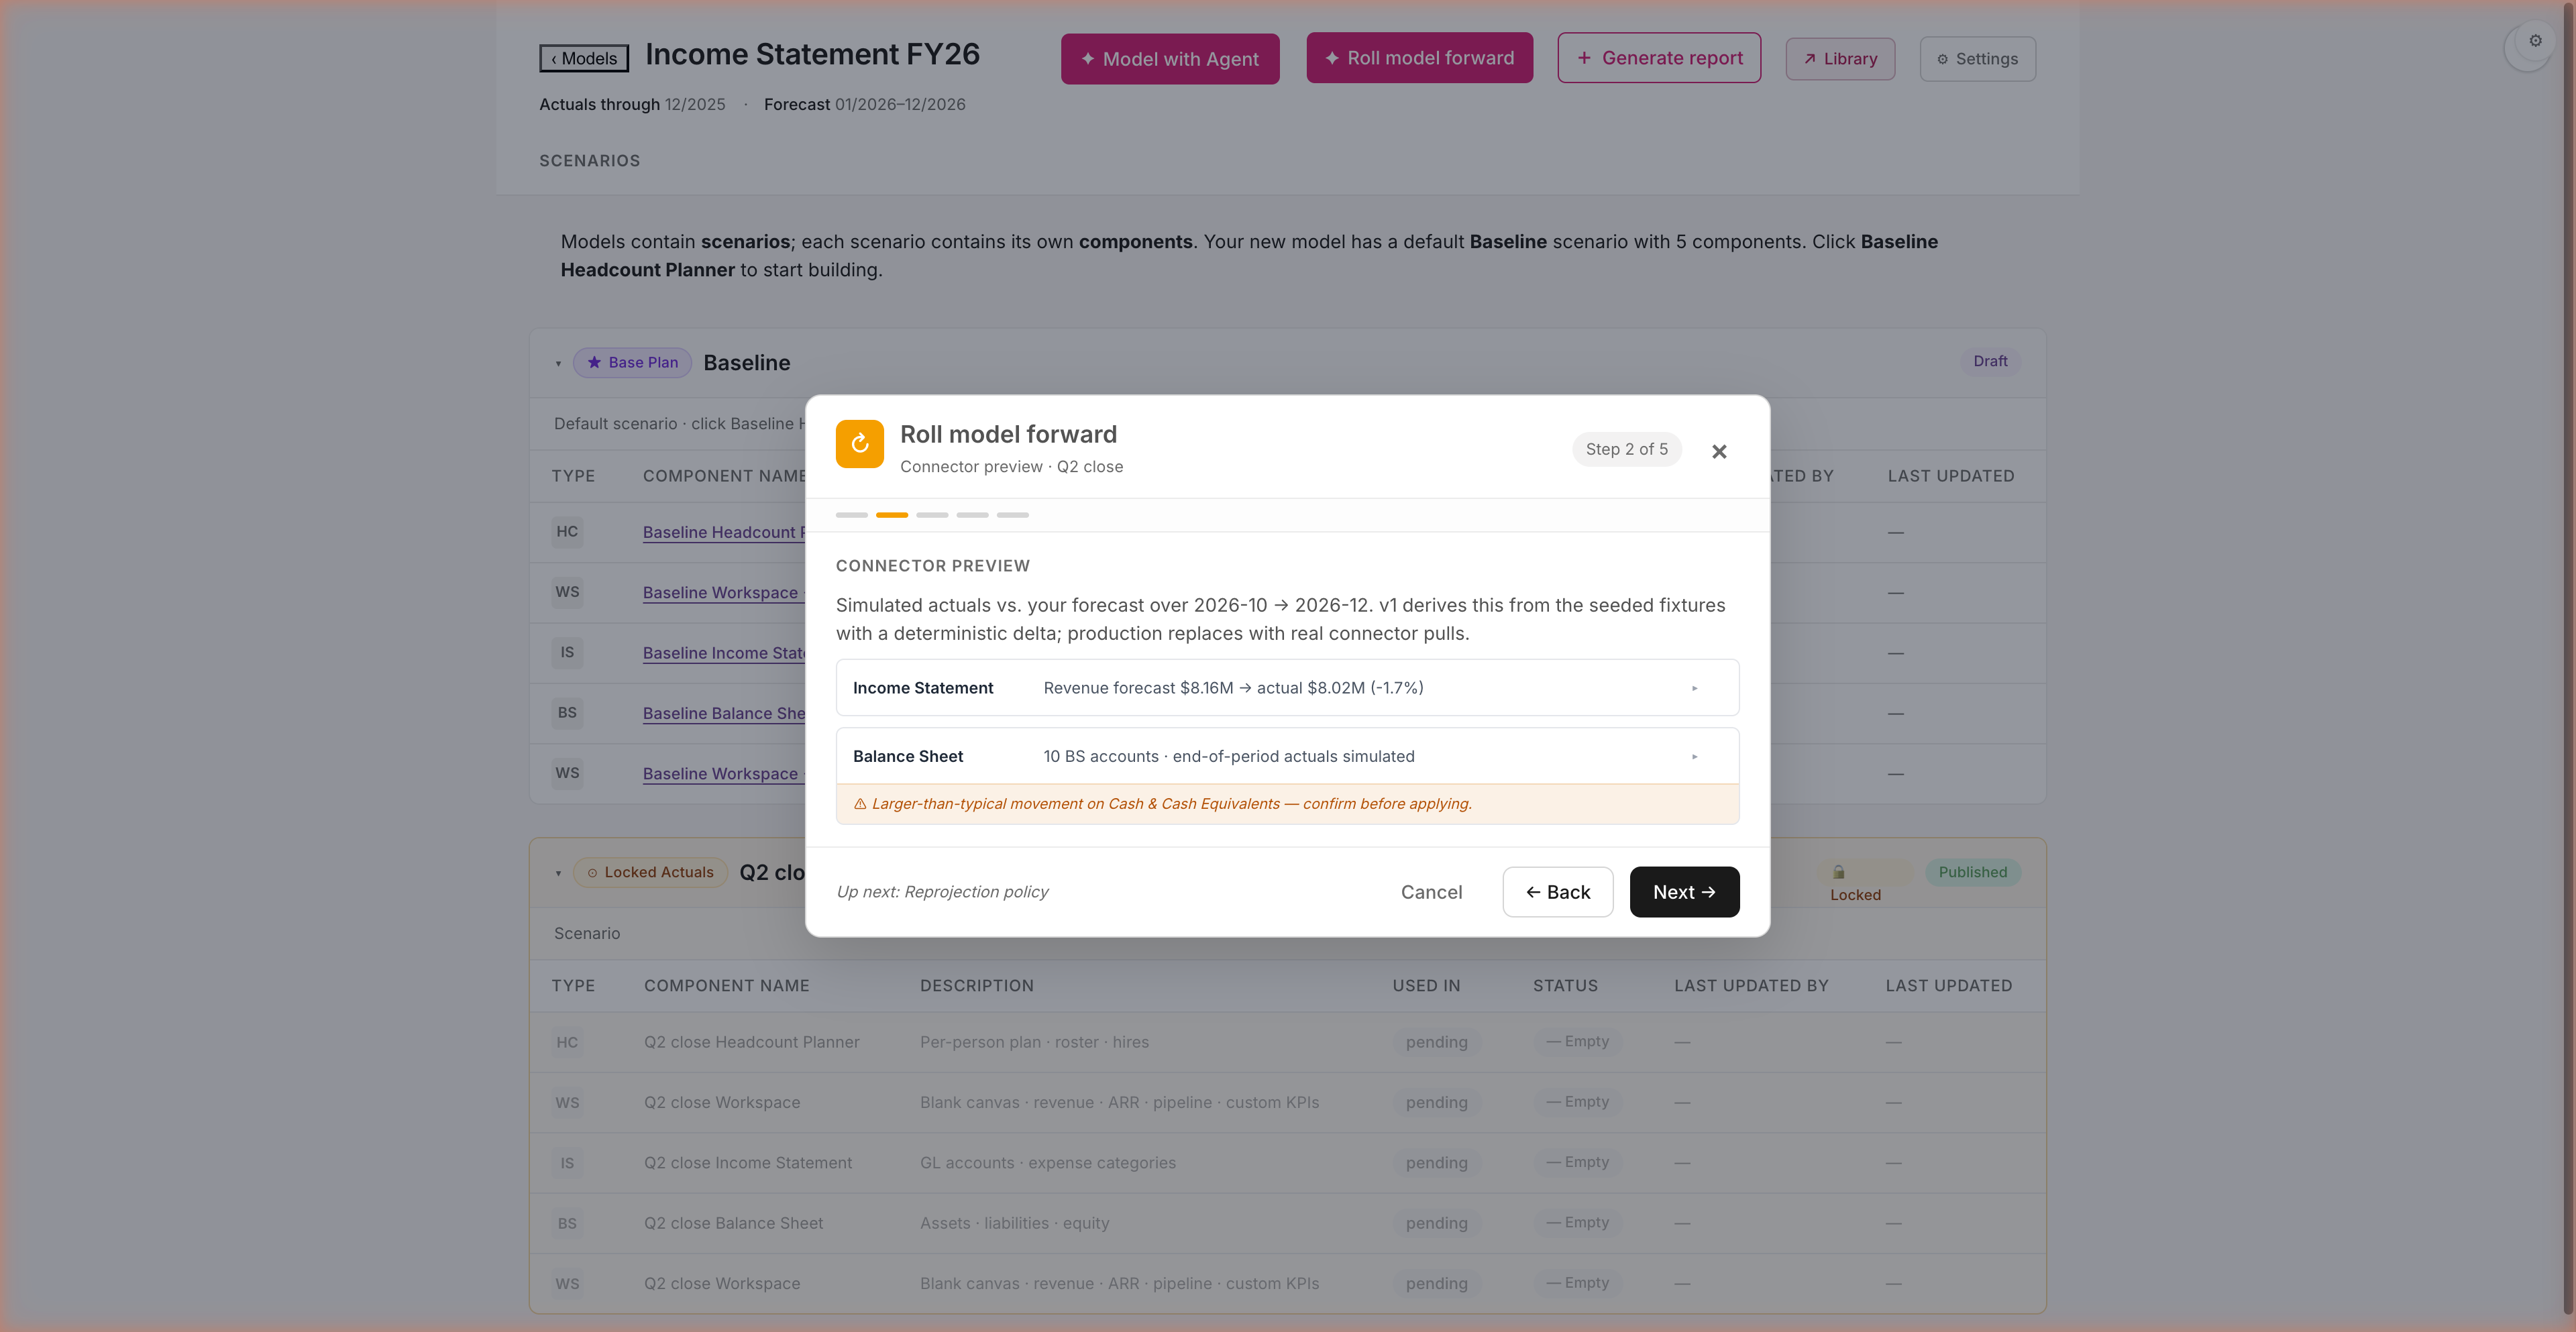
STEP 11b · VARIANCE PREVIEW
See the variance before you commit.
Step 2 of the wizard simulates connector pulls and surfaces material movement up front. Soft-warning banners on lines that cross ±20%.
See the variance before you commit. Revenue, OpEx, balance sheet movement — all surfaced as deltas vs your forecast, with a wide-delta banner on lines that crossed ±20%. You decide whether to apply, branch, or ask questions first. No surprises live in your forecast.
bobfinance · fy26-budget-deck16 / 22
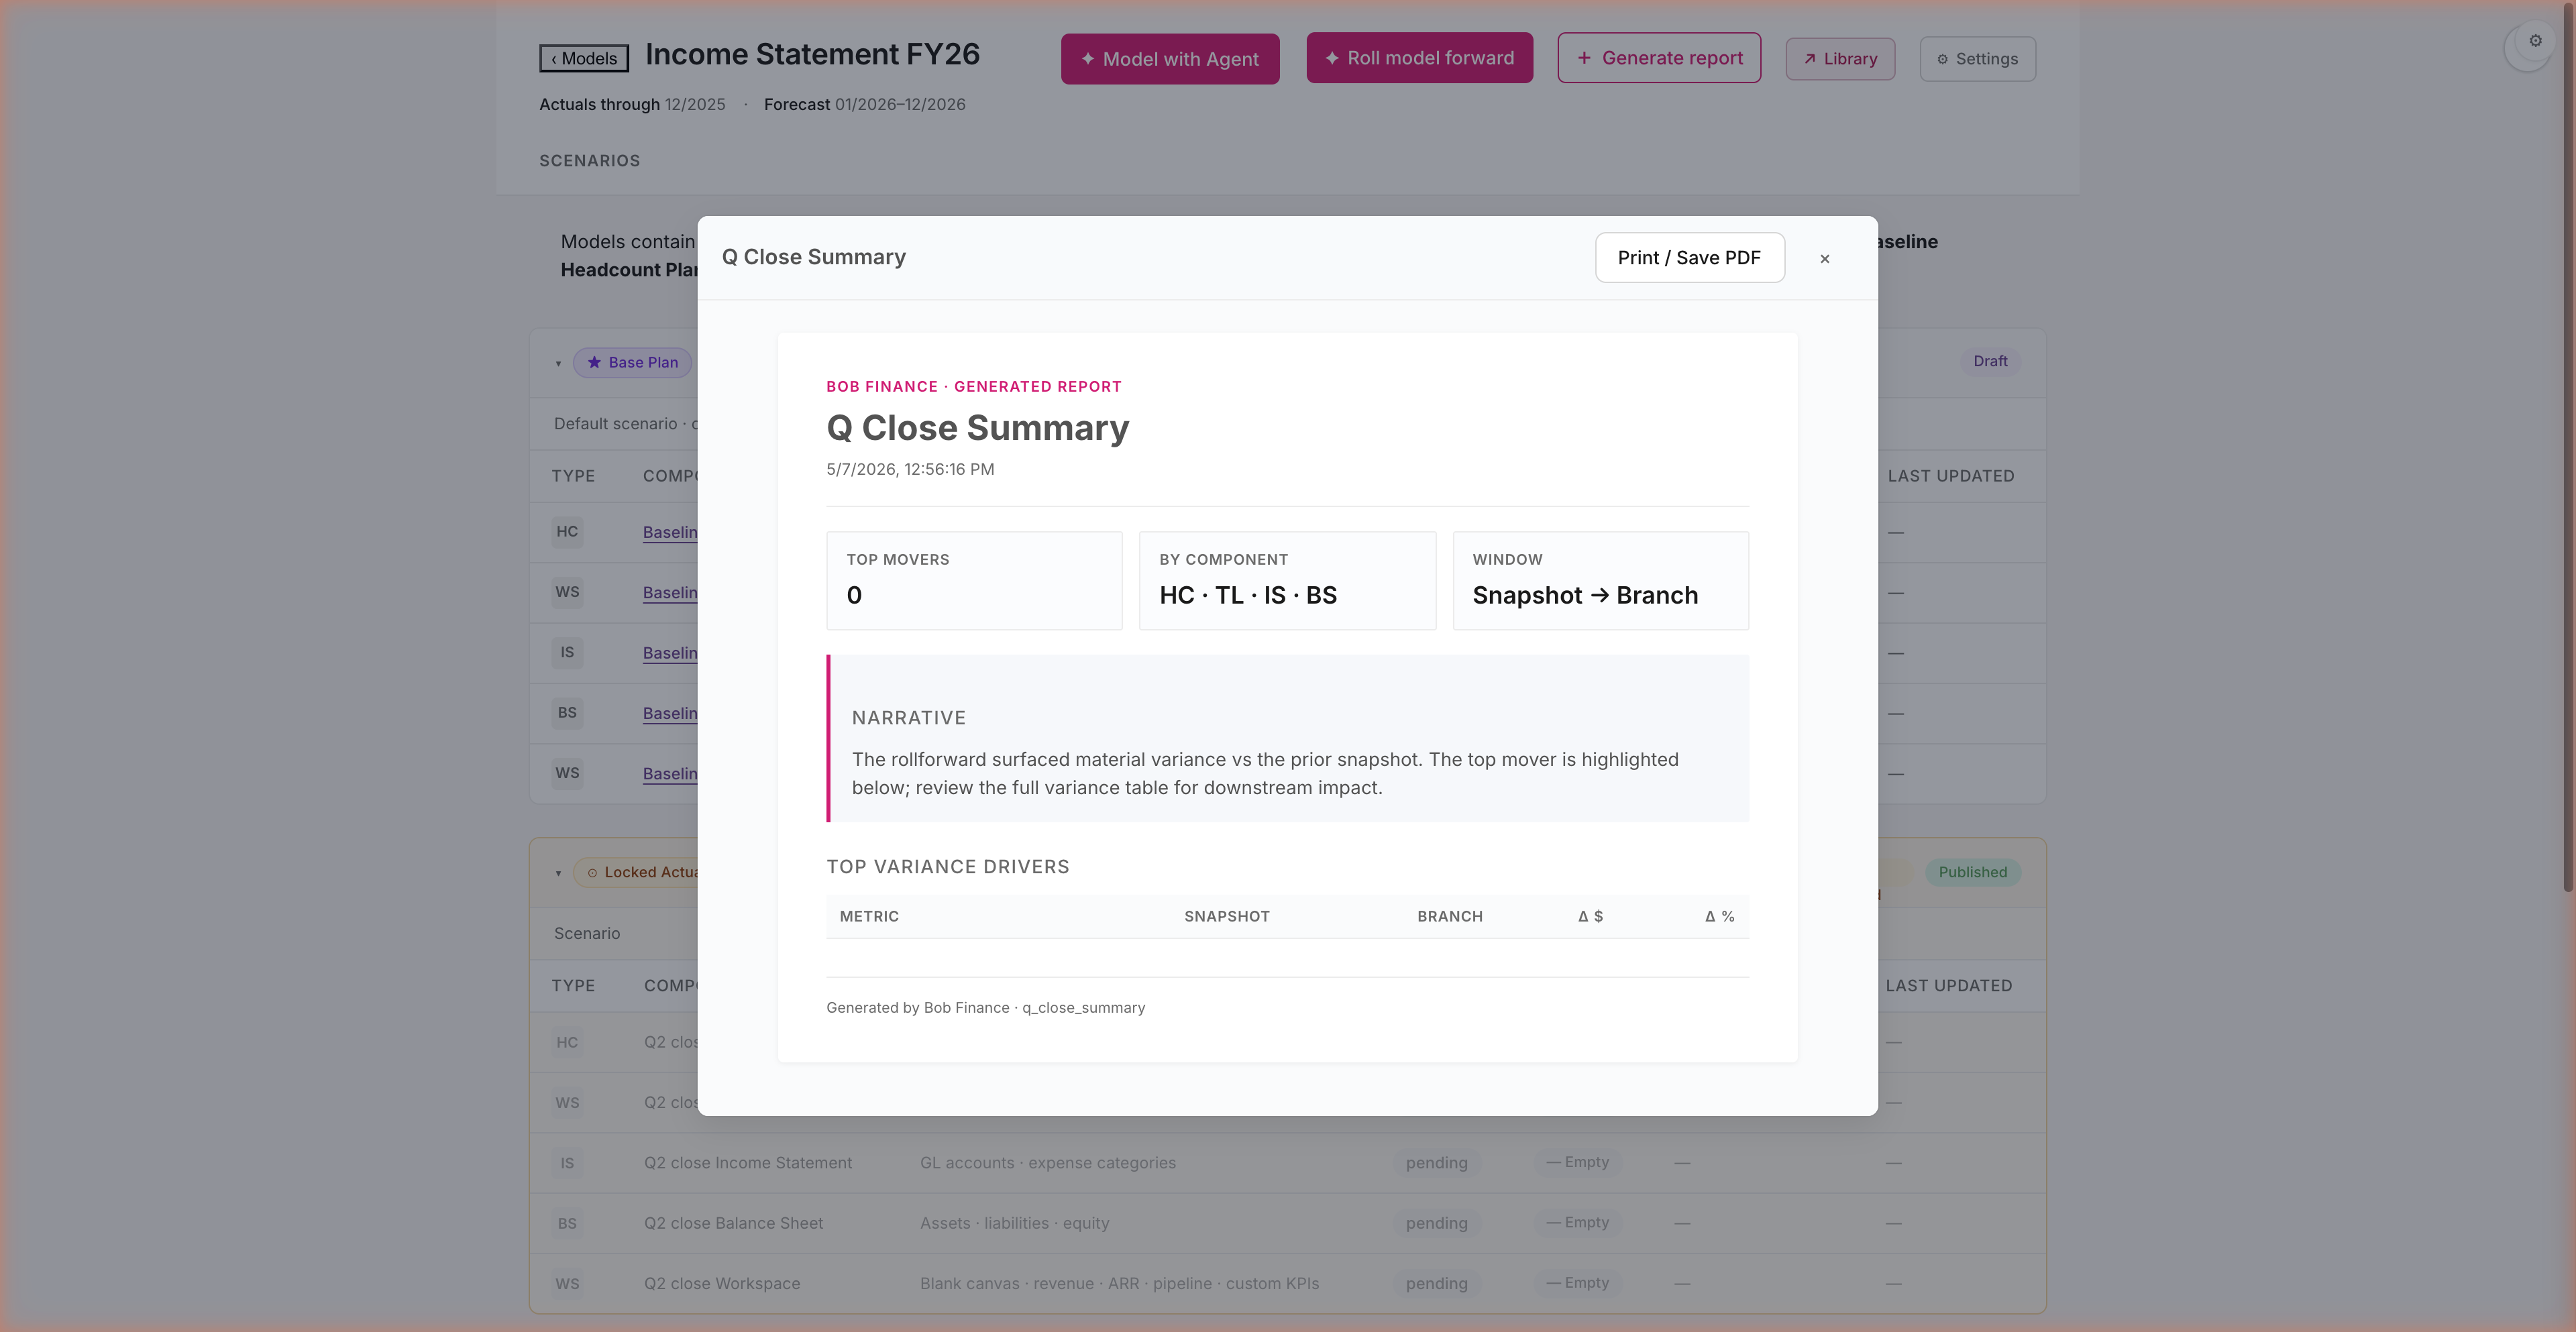
STEP 11c · CLOSE-OUT VARIANCE REPORT
Q Close Summary — your post-close recap.
After the rollforward applies, click Generate report → Quarter-close summary. Out comes a printable variance recap — built by the same engine as the model.
The post-close board pack writes itself. Snapshot vs. branch · top movers ranked · narrative auto-generated from the variance walk. 30 seconds vs. half a day of formatting in Excel. Print, Save PDF, share — the same audit trail the model carries flows through to the artifact you hand to the CFO.
bobfinance · fy26-budget-deck17 / 22
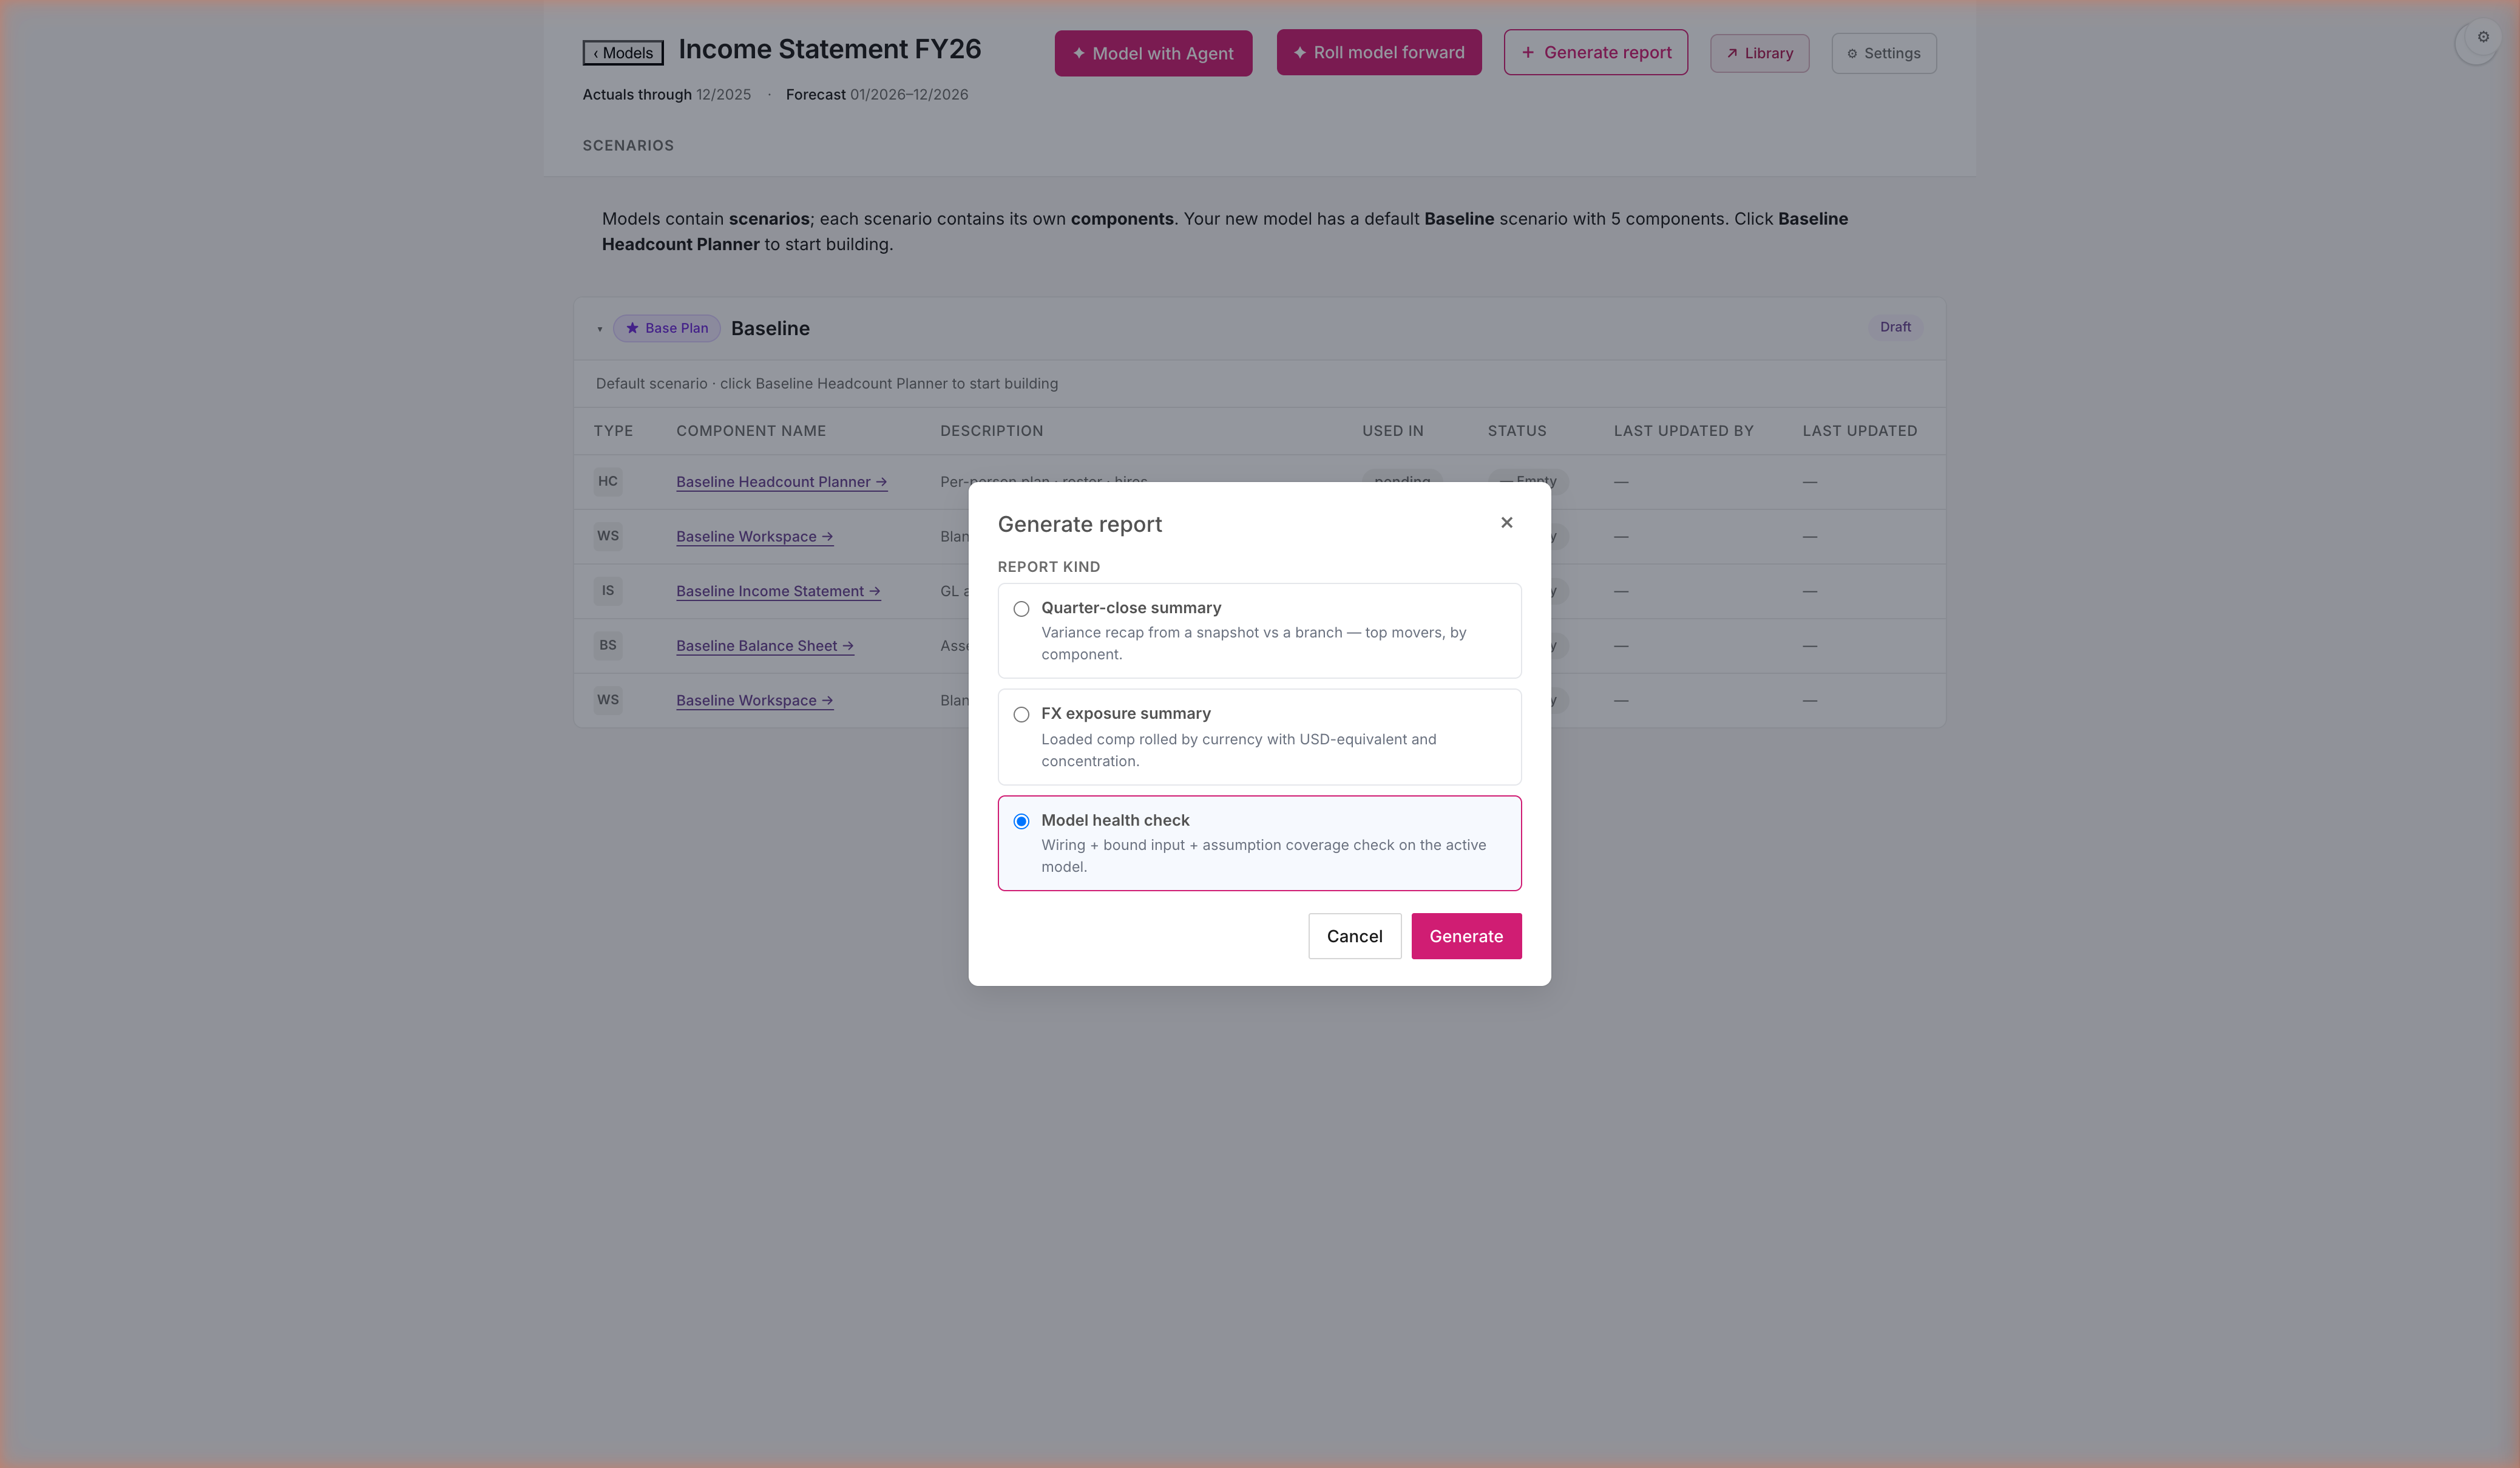
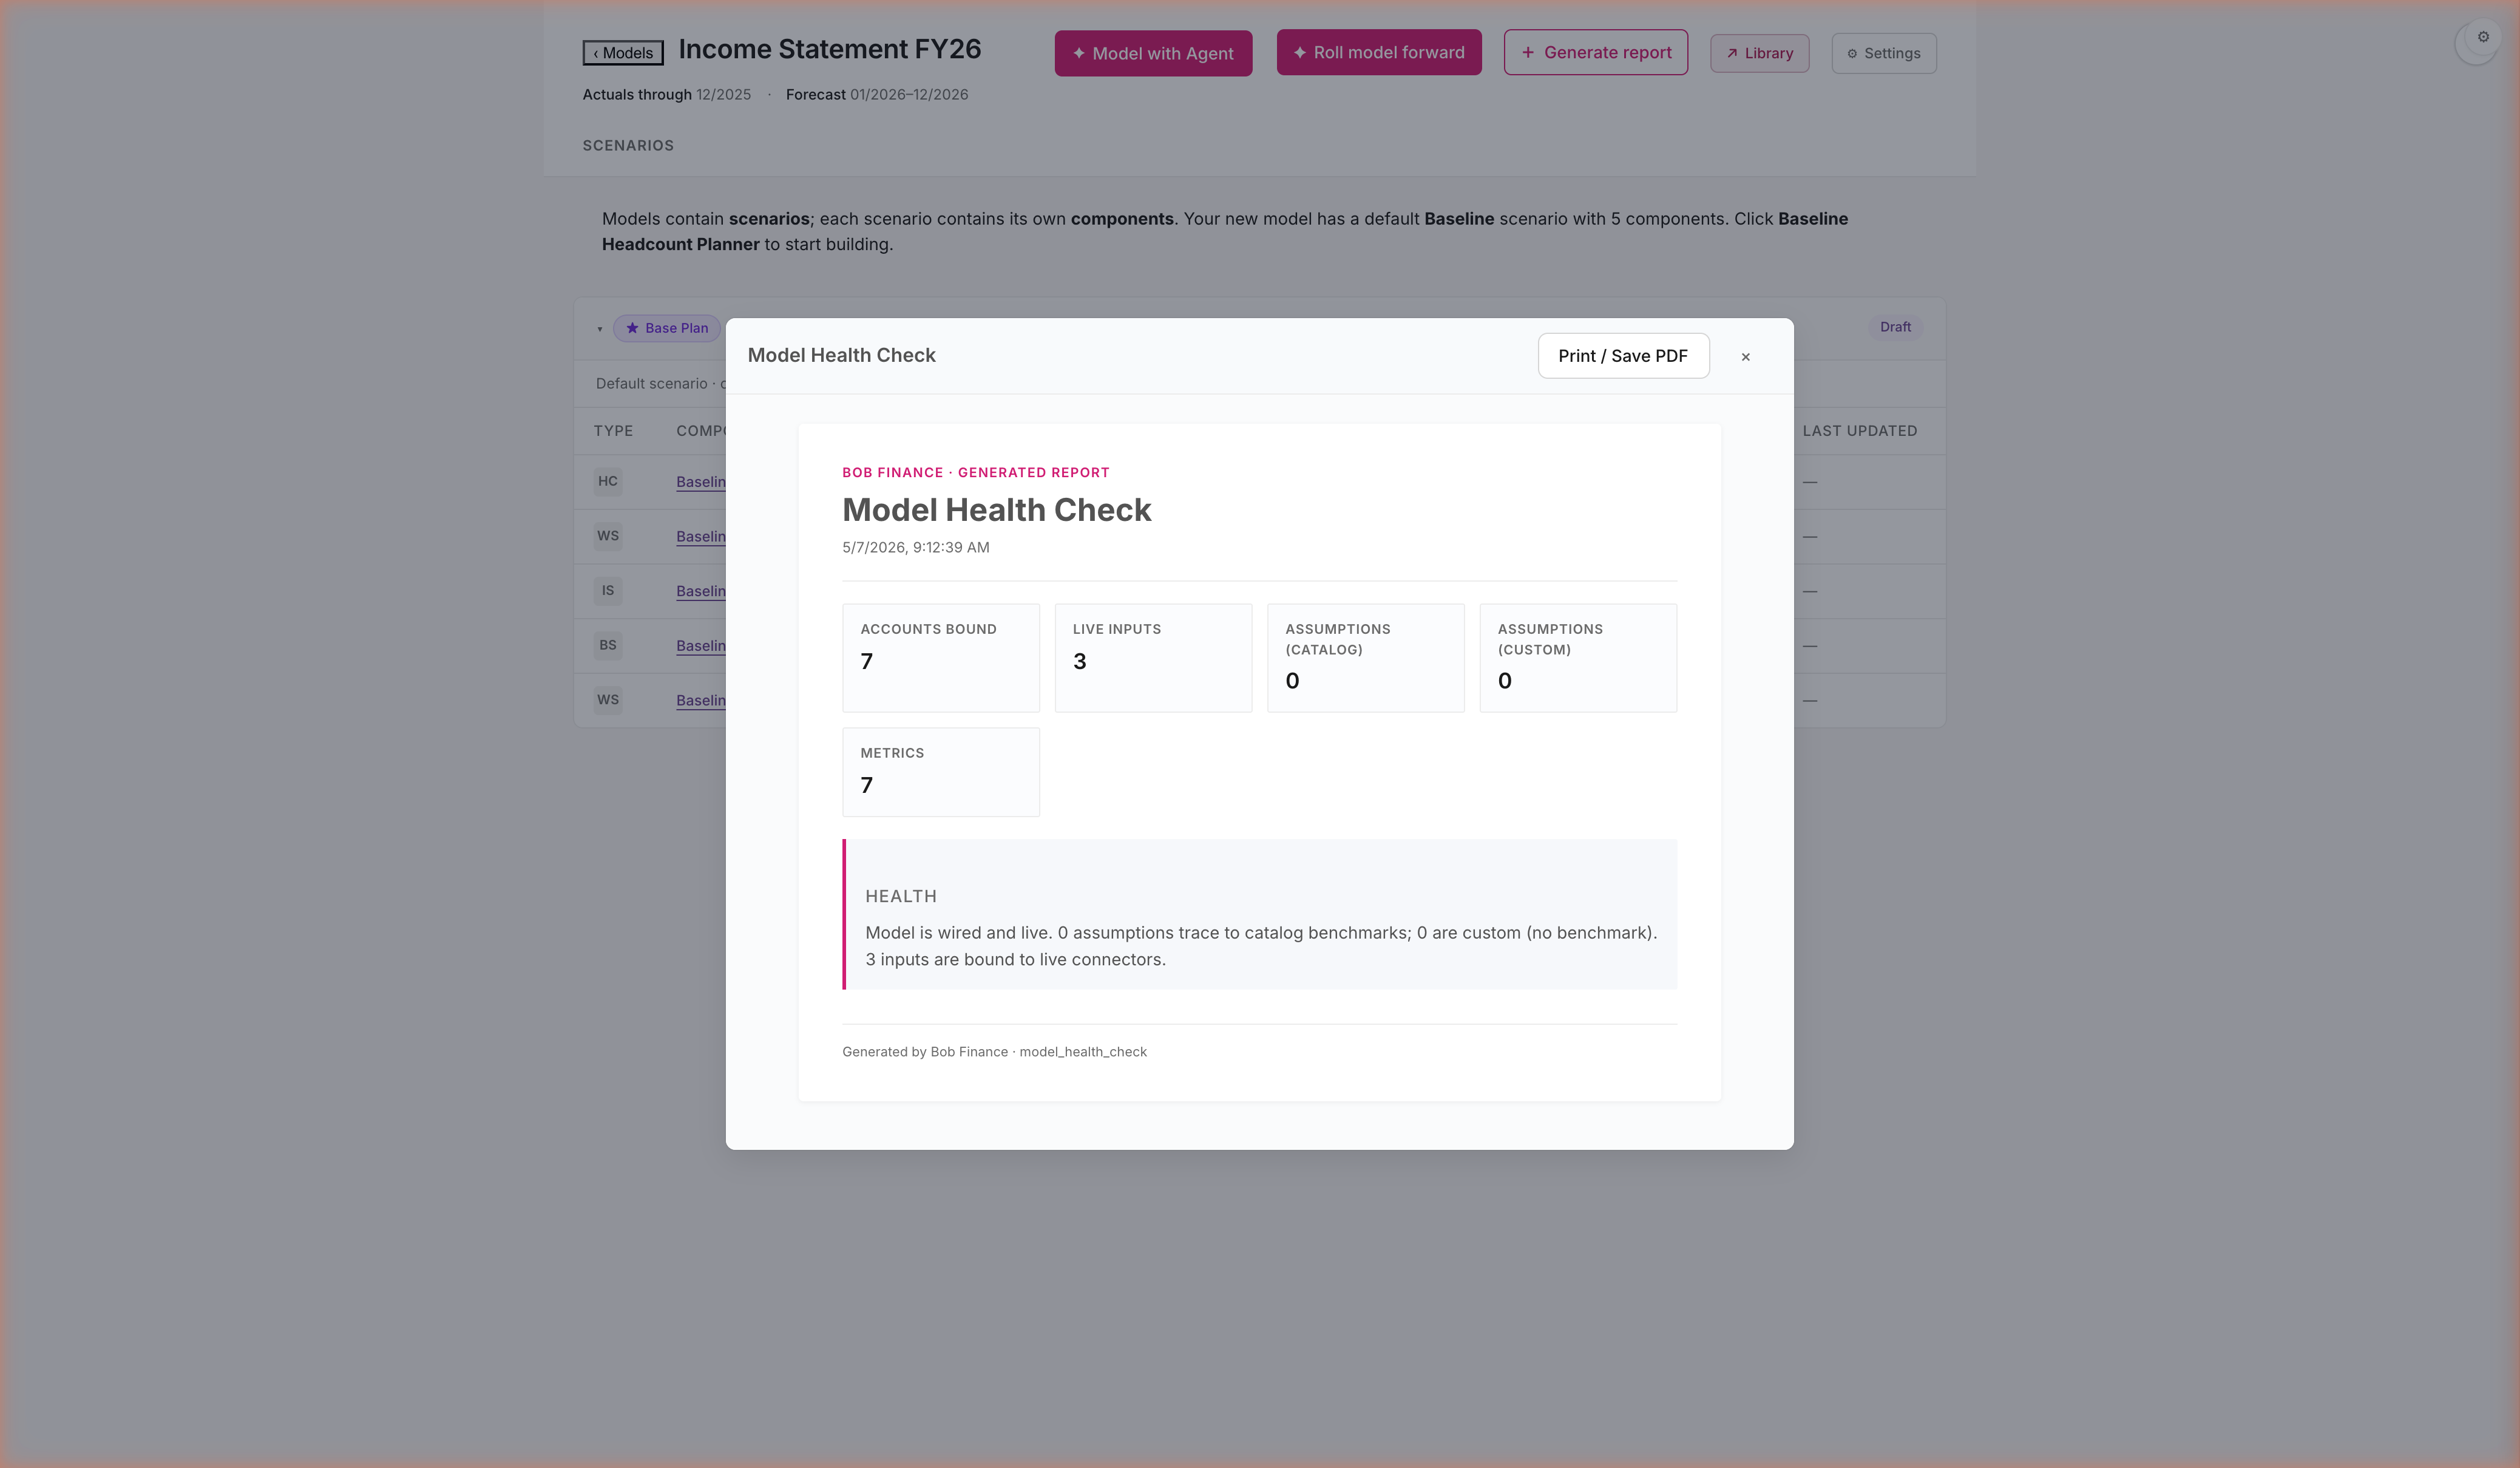
STEP 13 · BOARD PACK
Generate the close report — 30 seconds, ready to share.
Three report kinds: Quarter-close summary, FX exposure summary, Model health check. Catalog lookup, not bespoke build.
Three reports, one click each. Quarter-close summary · FX exposure · Model health check. Same engine, same data, same citations as the model — no re-typing, no copy-paste, no PowerPoint reformat. The CEO sees the polished artifact; you keep the working model.
bobfinance · fy26-budget-deck18 / 22
STEP 13b · REPORT
Variance recap, rendered. Print or share.
Same engine that built the model produces the report. No re-typing, no copy-paste from screenshots into PowerPoint.
Plan → build → close → report, without leaving the platform. The report cites the same catalog entries the model uses. If anyone asks where a number came from, the answer is one click away — same path you used to build it. One workflow, one source of truth.
bobfinance · fy26-budget-deck19 / 22
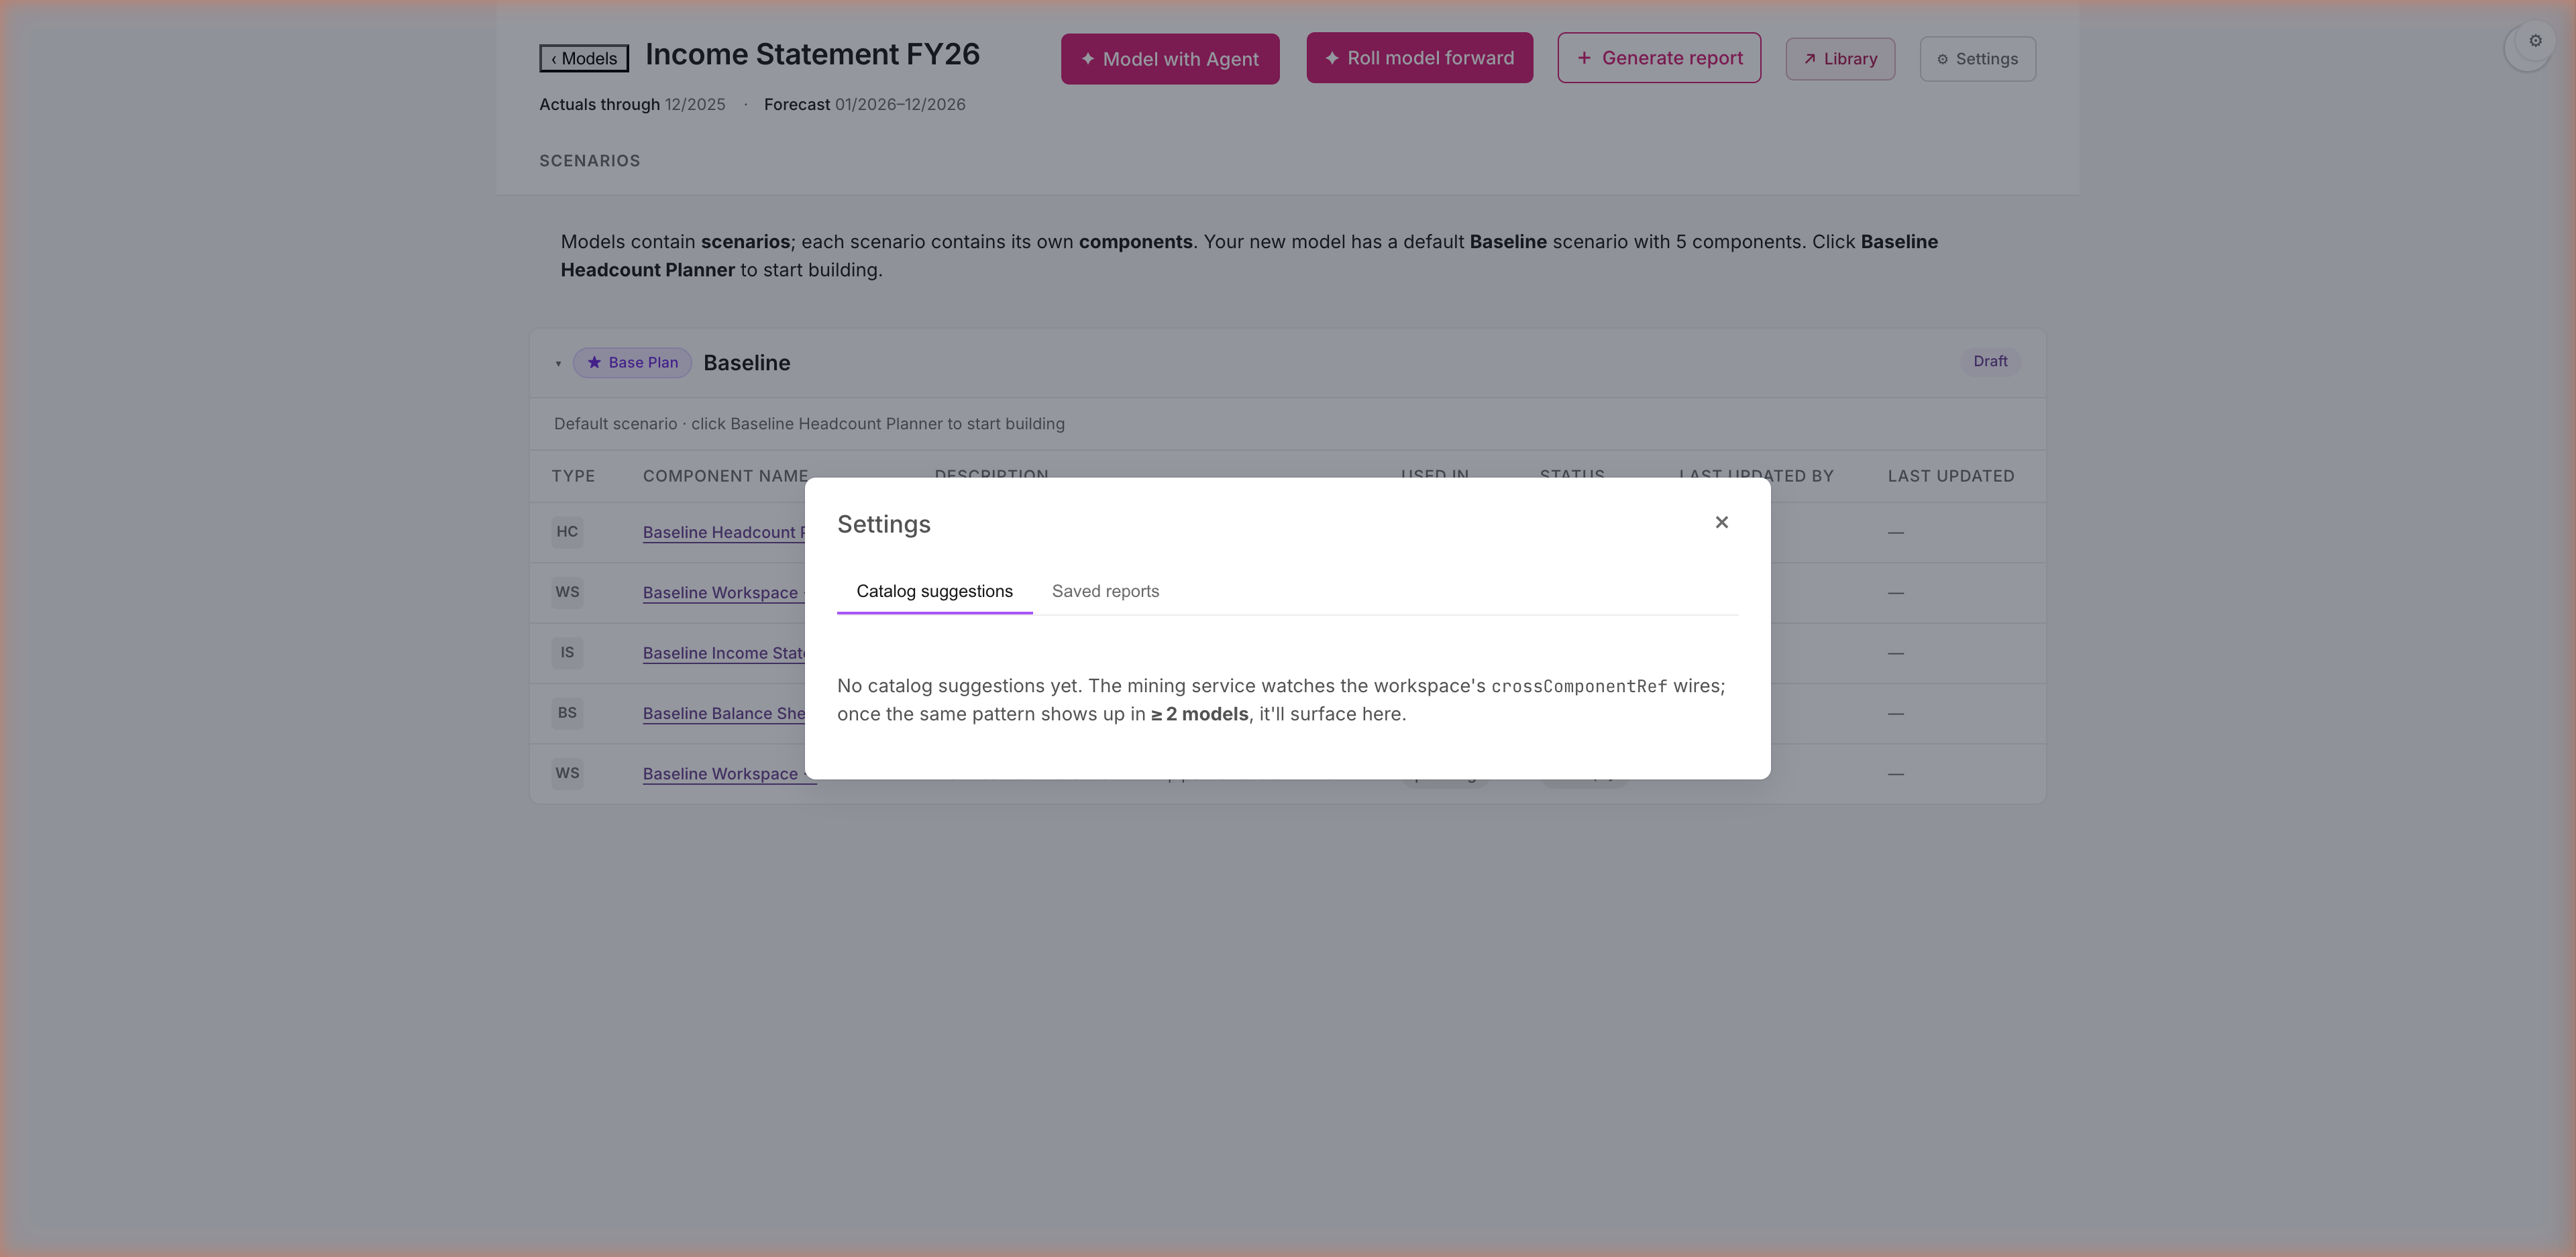
STEP 14 · CATALOG LEARNING
The catalog learns. Future models start smarter.
When the team wires the same relationship across multiple models, the catalog promotes it as a default. Settings → Catalog suggestions tracks what's queued.
Your team's modeling patterns become institutional knowledge. When two models wire IS Salaries ← Headcount Roster, the third gets a banner: "Apply this default?" Q2's planning starts smarter than Q1's. Most FP&A teams reinvent the same wheel every cycle; this tool gets sharper the more your team uses it.
bobfinance · fy26-budget-deck20 / 22
Battle-test results · 15 of 15 steps verified.
May 7 2026 · live walk-through against the running prototype after PR35 ship · 489 tests passing · clean build.
✓Step 1 · Existing comp ($22M)
✓Step 2 · Provenance (IRS / SHRM / Vanguard / Bloomberg)
✓Step 3 · + Add employee + Plan card
✓Step 4 · Library + GLOBAL scope chips
✓Step 5 · IS auto-populated (PR33)
✓Step 6 · Group by Sub × Dept (PR31)
✓Step 7 · Workspace blank-spreadsheet (PR33)
✓Step 7b · Agent scaffolds the topline (plan card)
✓Step 8 · Workspace ARR ($28.8M → $32.6M)
✓Step 10 · Recession Compare
✓Step 11 · Rollforward 5-step wizard (PR34)
✓Step 11b · Variance preview · Step 2 (PR34)
✓Step 11c · Q Close Summary report (PR35)
✓Step 13 · Generate report
✓Step 14 · Settings · Catalog suggestions
Live battle-test exposed one bug: the variance report errored on a HyperFormula named-expression (hyphen in Revenue_actual_2026-12). Sanitizer fix shipped as PR35 alongside this deck — both halves of the close-the-quarter loop (pre-apply preview · post-apply Q Close Summary) now render end-to-end.
bobfinance · fy26-budget-deck21 / 22
Real data. Real plan.
No black boxes.
We forecast 148 existing employees. Added 12 forecast hires. Layered on a 10% bonus accrual. Built a P&L grounded in 24 months of real GL history. Forecast revenue bottoms-up against $19.5M of Salesforce pipeline. Spun up a Recession scenario. Rolled forward Q1. Generated the close report. Promoted the learnings to the catalog.
Every number cited a source. Every plan was approvable before it ran. Nothing was hallucinated. Two scenarios diverged by $2.6M and we know exactly which assumption drove the gap.
Twenty-five minutes against the same data your finance team already has.
bobfinance · fy26-budget-deck22 / 22